Brief
"To plan and implement your own social media campaign to promote your personal website/web portfolio, gaining as many unique visits to your personal website."
Overview
As part of my second semester of my second year, I was required to undertake a social media campaign to promote myself, my website or another company. I decided to promote my website as this would have helped to promote myself also, displaying my work and interests in website development.
This project involved aspects such as presenting weekly statistics throughout different social media platforms as well as being able to manage my time effectively, setting times for posts to be released throughout various days.
All of the processes for this project will be viewable on this page.
For a more detailed process, I have included a document situated at the bottom of the page.
Initial Ideas/Research
Overview
To begin this project, I brainstormed some ideas of different aspects which would have needed to have been included in the social media campaign as influenced by some research as well. As will be evident below, I focused on the areas that had been mentioned in the module brief such as content and objectives.
The Brainstorm of Initial Ideas/Research
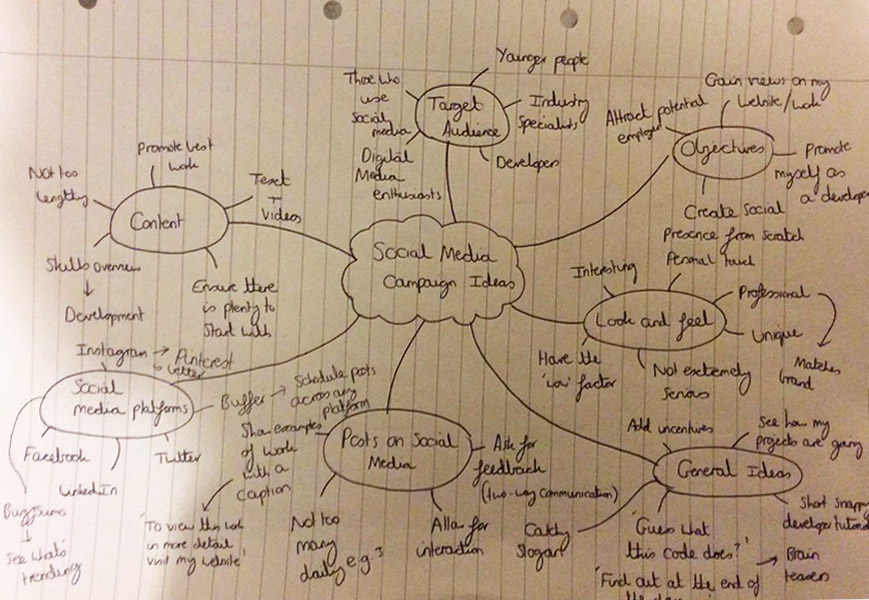
A Brainstorm of Initial Ideas/Research
Key Research Influencing the Campaign
Target Audience Research
Overview
Further on, I established my objectives of my campaign. These were attracting potential employers/industry specialists, persuading more people to view my website, promoting myself as a developer and teaching people who were interested in development, especially website development, about my current experience and what aspects I had discovered as well as useful things I had learnt.
This then meant I could now undertake a variety of research. A more detailed process of this can be viewed in the action plan placed at the bottom of this web page. I undertook research on the audience and demographics which can be viewed below. All references are included in the action plan and portfolio document at the bottom of this page.
My target audiences included industry specialists/potential employers, especially in the website industry and also those interested in learning about development, especially website development. The two age ranges of my target audience included 18-29 years and 30-49 years. This was due to the fact that the research displayed below suggested that the average age of a developer was 28 years and that companies often employed younger and more inexperienced programmers, promoting the older programmers to a more senior role (Eadicicco, 2015)(Eadicicco, 2014). The expertise of both the older and younger developers would have therefore become essential to myself in gaining more experience.
The Collected Demographics Research
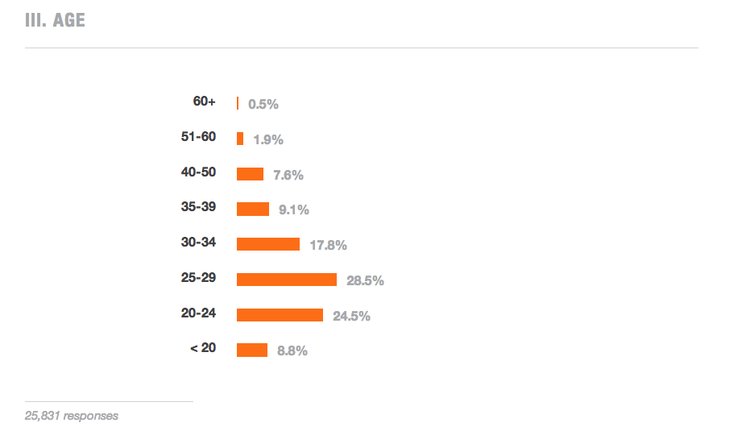
Age Demographics Research in General
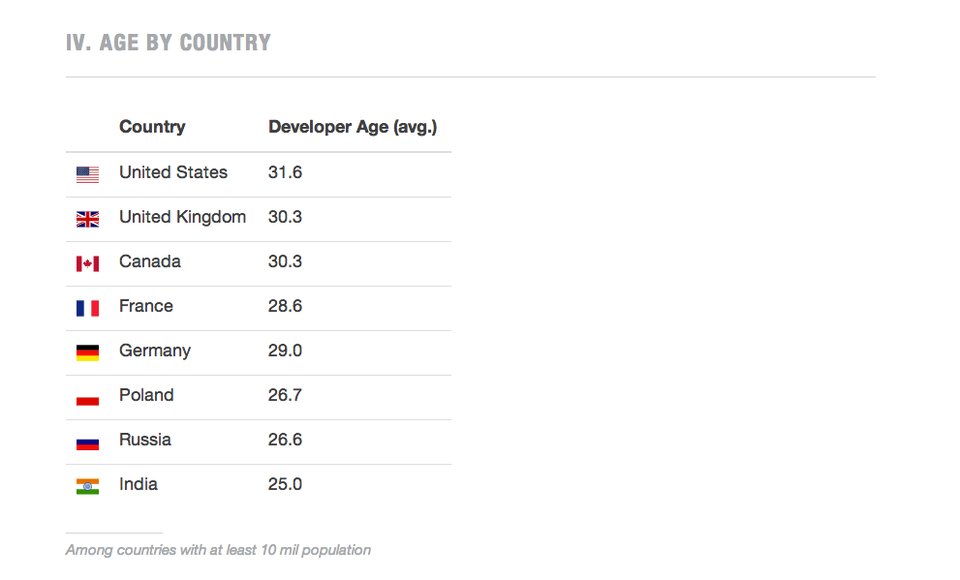
Age Demographics by Countries
Social Media Platforms Research
Overview
With regards to the social media channels, I chose three which were 'Facebook', 'Twitter' and 'LinkedIn'. Key demographic research included the fact that 82% aged between 18 and 29 online used 'Facebook' with 79% aged between 30 and 49 years having used it and 56% of people aged 65 years or older having used it (Fontein, 2016).
I also found that 32% of Internet users aged 18-29 years had used 'Twitter' with statistics decreasing to 13% for 50-64 year olds and even further to 6% for those aged over 65 years (Newberry, 2016).
For 'LinkedIn', I found that the majority of users were aged between 30 and 64 years old at 61% with almost 25% of users aged between 18-29 years old (Fontein, 2017).
For more research and detail, either view the portfolio document or the social media action plan at the bottom of this page. The objectives I had set for 'Facebook' were to obtain at least 20 followers and 20 likes for the 'Facebook' page. Regarding 'Twitter', I wanted to obtain at least 25 followers and for 'LinkedIn', I wanted to achieve at least an increase of six connections by the end of the campaign.
The Chosen Social Media Platforms to Utilise

'Facebook' Logo

'Twitter' Logo
'LinkedIn' Logo
Creating Target Audience Personas
Overview
After undertaking some audience and demographic research, I created a few personas to help myself understand how the campaign would have benefitted a variety of audiences. These can be viewed below and references are included in both the action plan and portfolio document at the bottom of this page.
The Created Personas
Persona 1
Tom, aged 19, is a student at the 'University of Cardiff' who is currently studying a creative technology course and he wants to view his competitors to gain inspiration for what to include on his website. He finds it difficult to fix issues with his code at times and fears that his website may not stand out from those of others and wants to know what he can include to make it stand out as well as developing his current skillset. He doesn't have a job outside of university and views 'Facebook' three times a day; in the morning, at lunch time and in the evening. He also uses 'Twitter' to view the latest news globally, looking at this whenever having breaks from studying. Tom has no girlfriend or children.
Persona 2
Lucy, aged 32, is very interested in coding and wants to learn about the types of things that can be achieved, starting by learning the fundamentals of 'HTML', 'CSS' and 'JavaScript'. This was something that she didn’t have the opportunity of learning whilst in education. She didn’t go to university but has an A Level in IT. She has always wanted to challenge herself as she is ambitious and she lives in the city of Manchester and has an interest in the latest technology. She uses 'LinkedIn' to view professional views as well as visiting websites such as ‘W3Schools’ and ‘StackOverflow’ to learn about different coding languages. She currently works as a sales woman in 'PC World' earning £12,876 annually, specialising in the latest technologies available. She is an expert in her field. Lucy has a boyfriend but no children (indeed, 2018).
Persona 3
David, aged 36, is a professional website developer working for the 'BBC'. He aims to help those who want to learn more about development but can’t find many people to target. He fears that content management systems are replacing website designers and developers and he wants to enhance people’s knowledge of coding. He lives in London and studied Computer Science at the 'University of the West of England' ('UWE') (UCAS, n.d.). He has a wife and two children and earns £40,544 annually (glassdoor, 2017). David uses 'LinkedIn' to find others in the same industry as him to discuss issues and problems and has 'Facebook' but uses this mainly for his personal life.
Competitor/Influencer Research
Overview
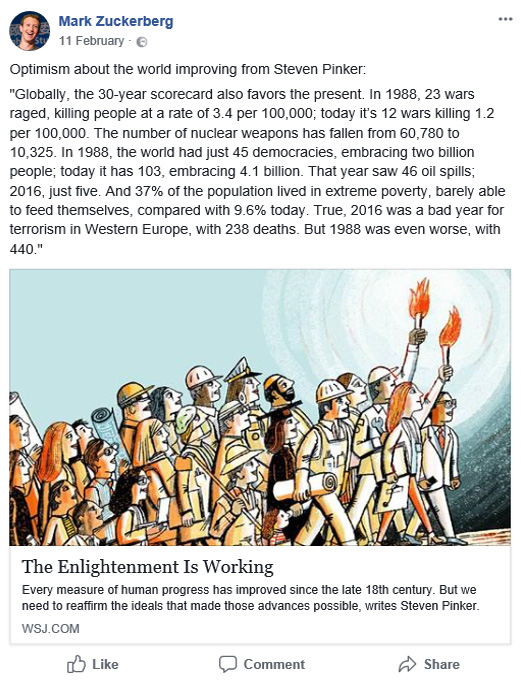
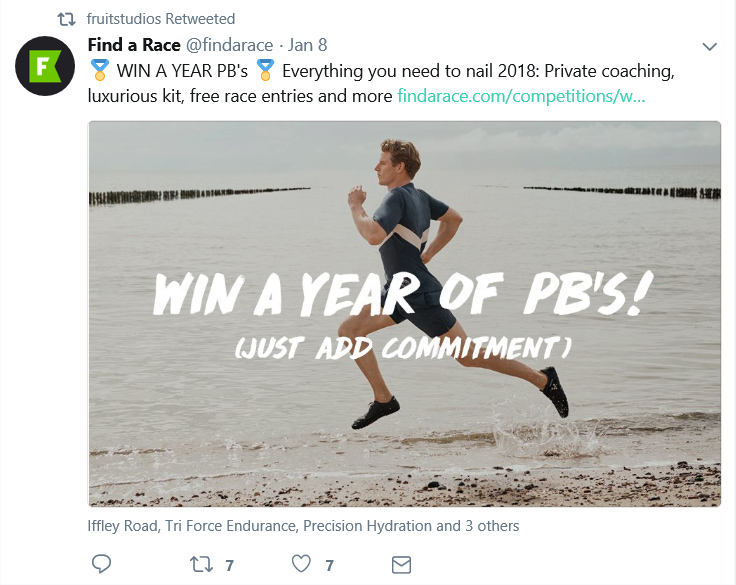
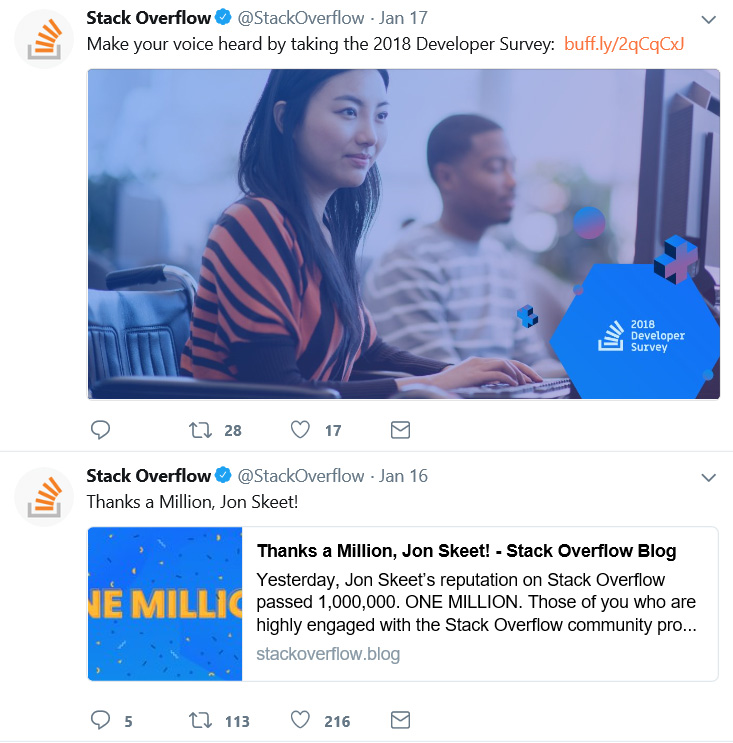
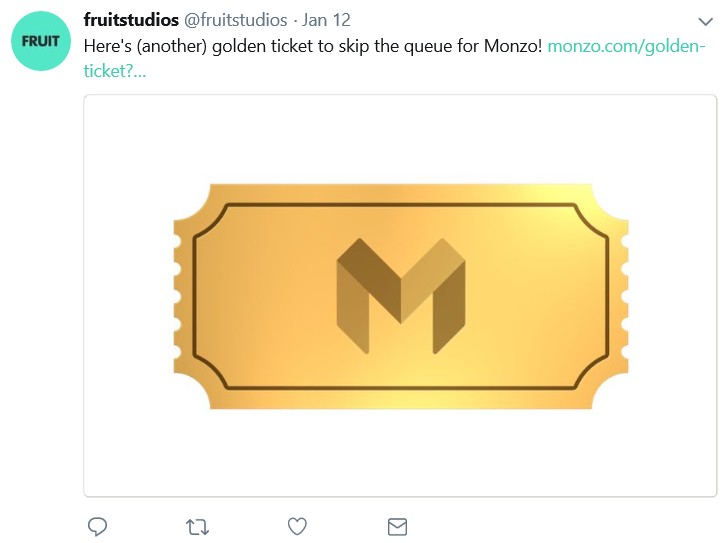
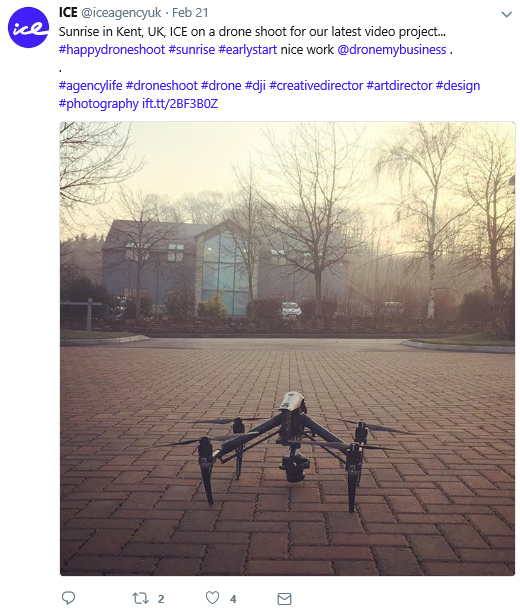
I also viewed current competitors or potential influencers and what content they were distributing. Some of the main ones I viewed were 'Stack Overflow', 'Mark Zuckerberg', 'Fruit Studios' and 'David Karp'.
I understood that a range of techniques were used for content. This included sharing articles, promoting blogs, retweeting other content, using hashtags, regular content delivery, promoting others and showing emotive content, sharing personal content, using of quotes, utilising lots of visuals, promoting events, connecting with followers, showing ongoing projects and also their own content.
Examples of the Content Distributed
Content Example 1
Content Example 2
Content Example 3
Content Example 4
Content Example 5
Previous Social Media Campaigns Research
Overview
Additionally, I undertook research on previous social media campaigns to understand how they were successful and to influence how I could have undertaken my campaign. These can be viewed below.
The first campaign was called 'Know Your Lemons' which raised awareness of the signs of breast cancer amongst women in a light-hearted manner. It also provided them with the opportunity to share stories with each other and a 'Facebook' page was established to allow people to read news updates on a regular basis, give donations and converse about the issue at hand. The visual approach was very effective as it could have been understood by anyone (Hughes, 2017).
The second campaign was 'Avoracle' which involved predicting football matches of 'Euro 2016' with an avocado due to the fact that they had a stone inside that is unpredictable with regards to what side it would have been on. They painted two hands reflecting who was playing against who and whatever side the stone was on, this would have predicted the winner for that match. Posts appeared in real time during each match which allowed for comments on each match. There were over 440,000 interactions, it reached out to over 50 million people and there were over 18 million video plays proving that it was a successful campaign (Sukhraj, 2017).
Visual Research of the Campaigns
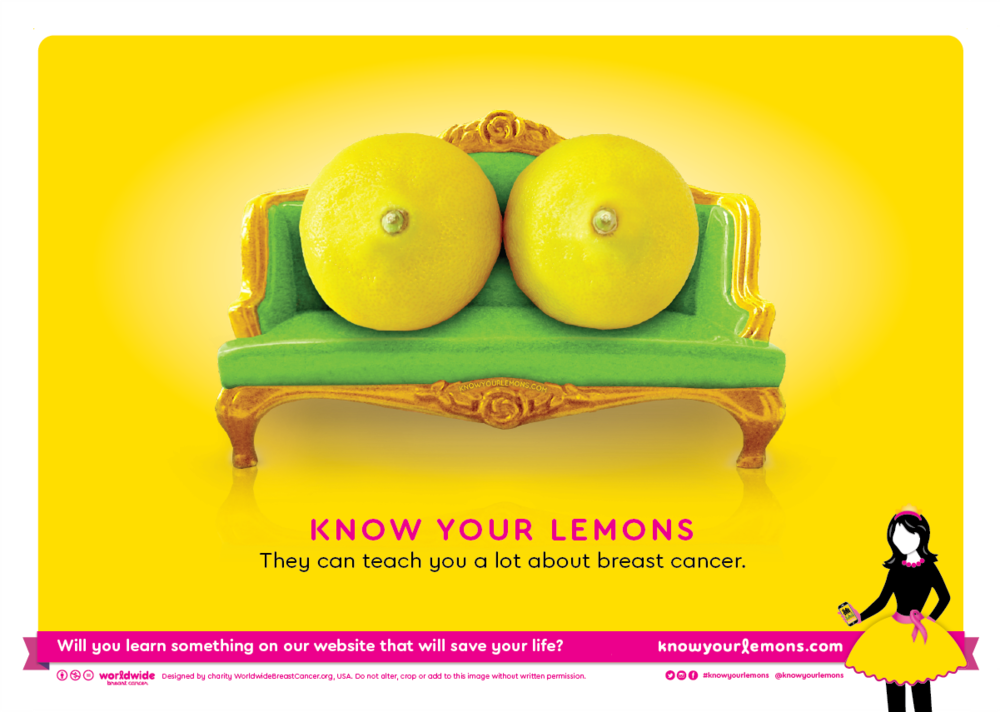
'Know Your Lemons' Campaign
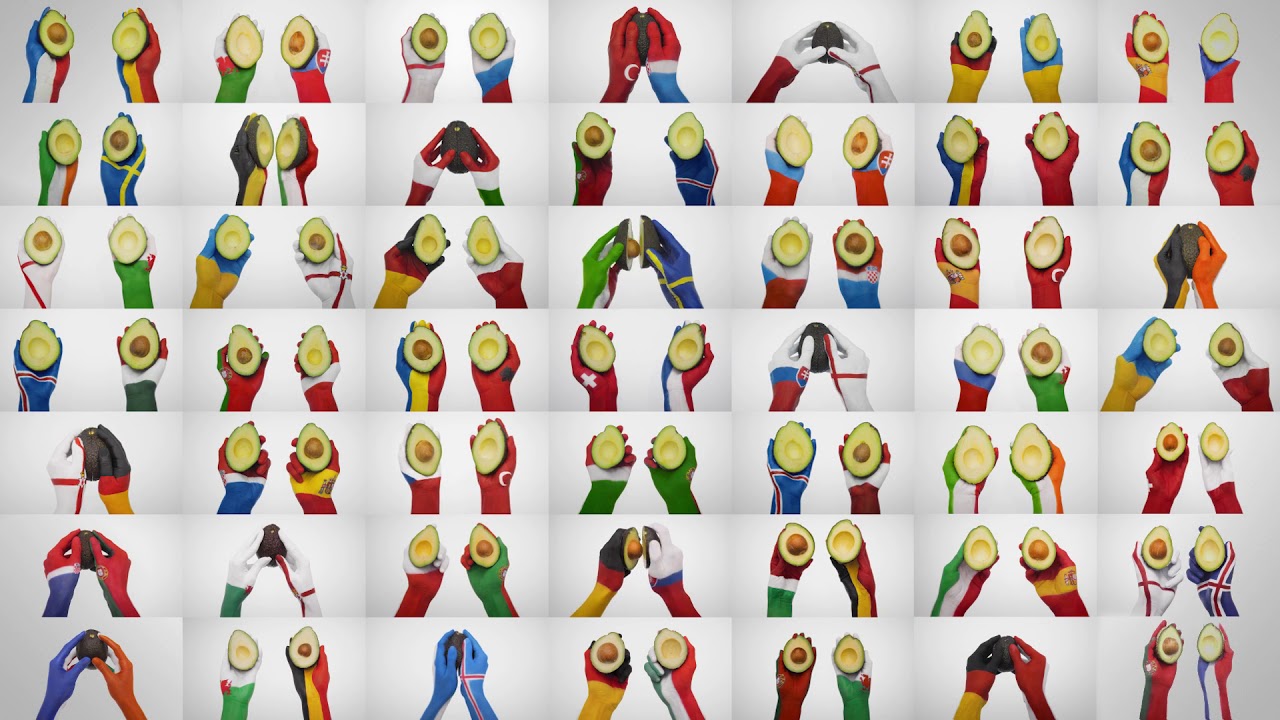
'Avoracle' Campaign
Regularity of Posting Research
Overview
The final piece of key research I undertook related to content posting which advised how many times to post on each channel as well as when to post. This can be viewed below.
Research Regarding All Platforms
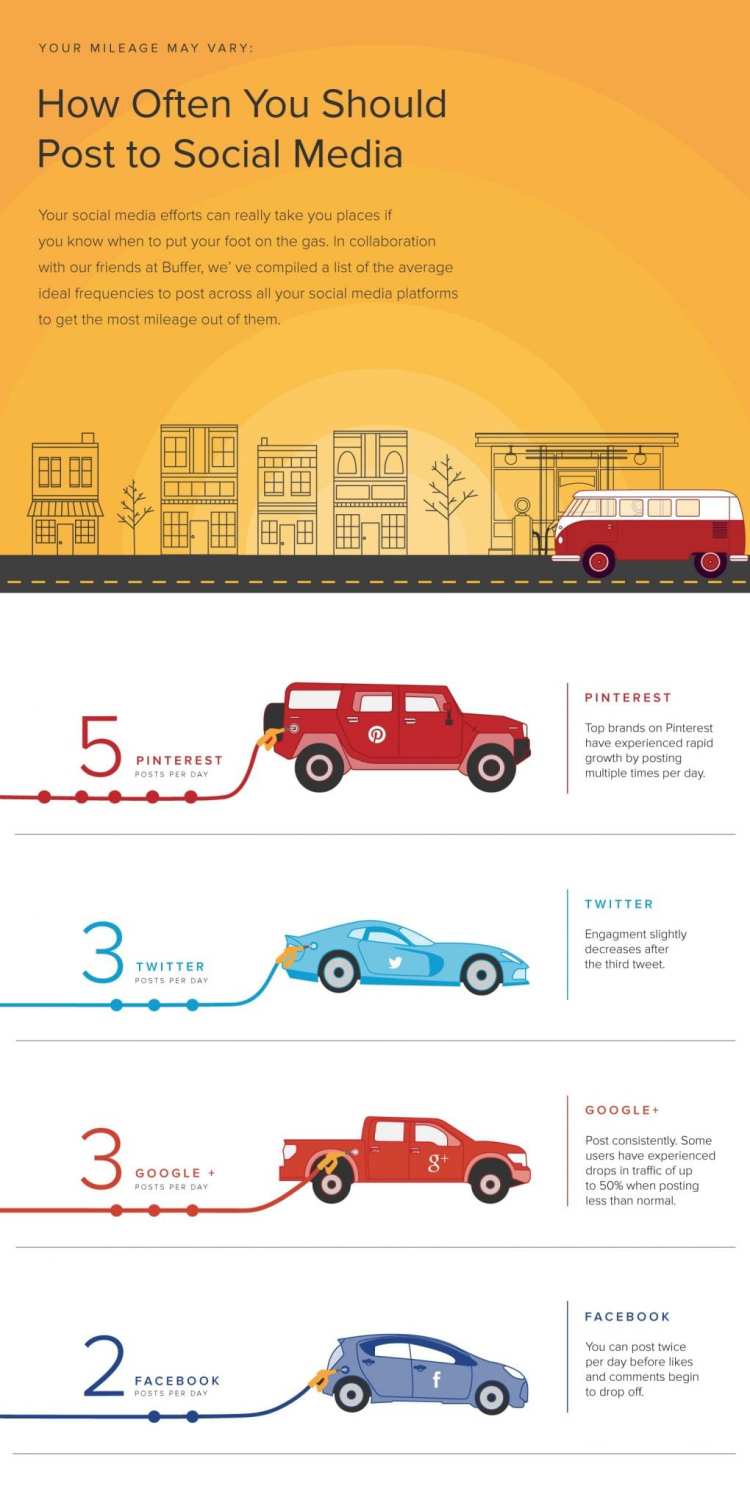
Quantity of Posts for Each Platform
Research Regarding 'Facebook'
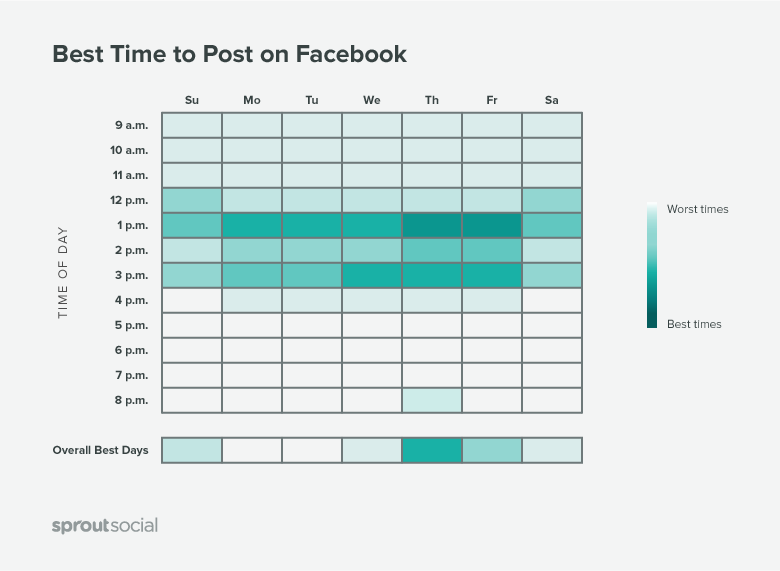
Best Times to Post on 'Facebook'
Research Regarding 'Twitter'
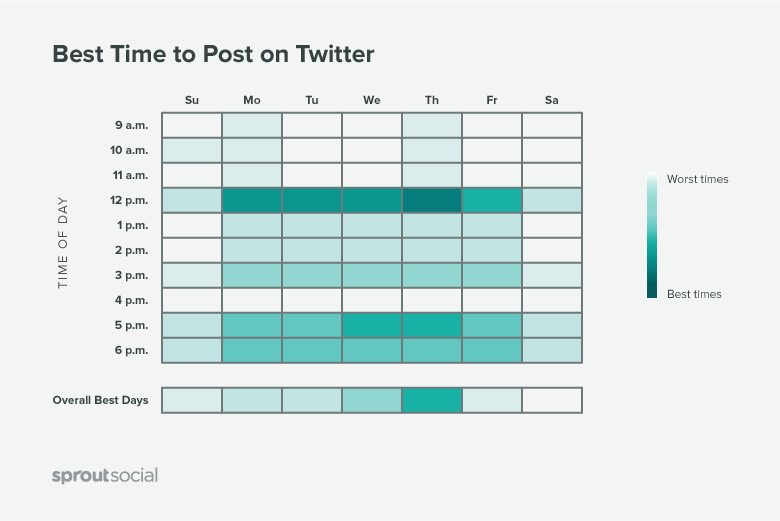
Best Times to Post on 'Twitter'
Research Regarding 'LinkedIn'
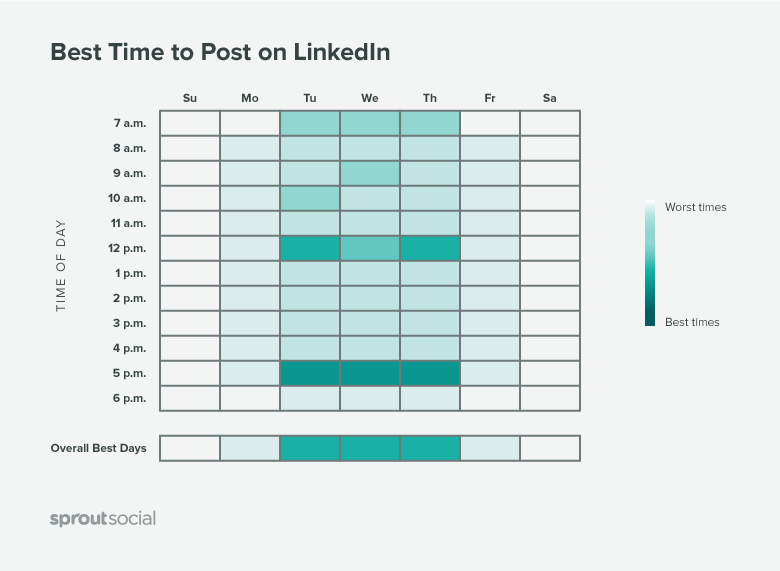
Best Times to Post on 'LinkedIn'
Final Preparation before Launching the Campaign
Overview
Before making the social media campaign 'live', I had produced several items to help myself remain organised which are viewable below. These were inspired by material provided to myself by the lecturer.
One of these items was a Gantt chart and this helped myself to understand the different processes that the campaign would have travelled through which therefore helped myself to know what tasks would have been undertaken at what specific times.
Another item was a task table and this helped myself to understand what would have needed to have been completed to fulfill the social media campaign from the very beginning.
I also created both a weekly content schedule plan and a responding schedule plan to help myself understand what I would have been posting and at what times and so that I would have known when and how to respond to actions by followers. As the campaign progressed, the content schedule did change due to time constraints and the responding schedule wasn't used as I understood that I received interactions at different times. This meant that when responding, I did this at various times as well. Both of these schedules couldn't be included visually on this web page unfortunately, so to view these in more detail, I have provided these below via links.
The Gantt Chart
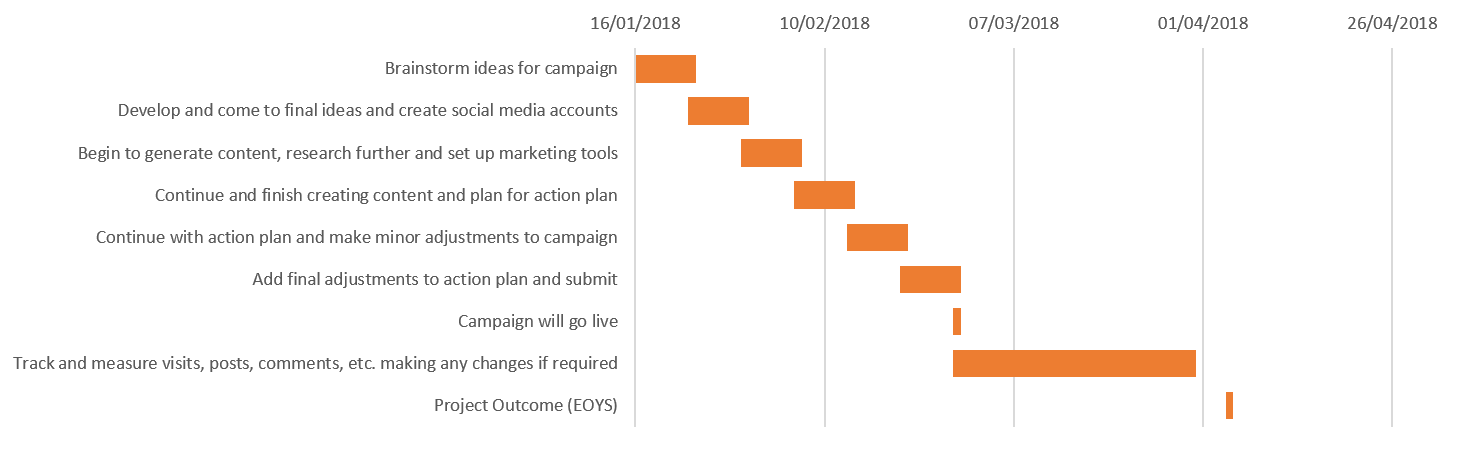
The Created Gantt Chart
The Task Table
The Weekly Content and Responding Schedules
The Weekly Content Schedule
The Responding Schedule
Branding of the Campaign
Overview
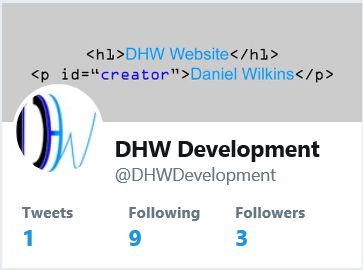
With regards to this aspect, I included elements which would have reflected a couple of my aims which were to promote myself as a developer and build up my brand as well as promoting my website. The branding that was utilised attempted to reflect the style of my current website which was one previous to this website.
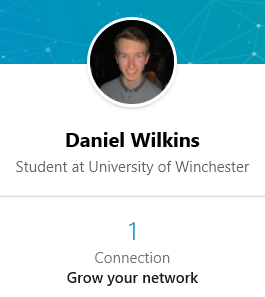
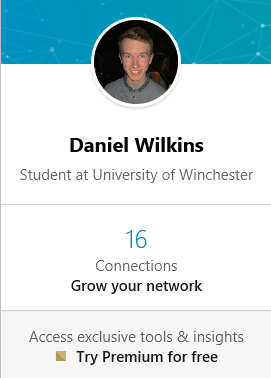
As will be evident below, I implemented the same brand on both 'Facebook' and 'Twitter' but on 'LinkedIn' I produced a profile that showed myself as a person as I understood that this was a social media platform designed to show skills of the user even though there were company pages which could have been created.
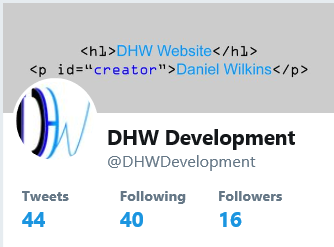
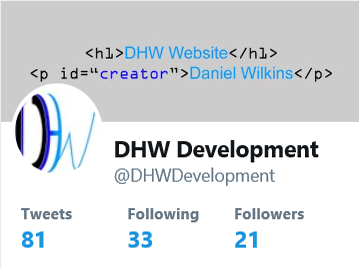
The name of the brand was ‘DHW Development’ for both 'Twitter' and 'Facebook' but the '@dhwdevelopment' was utilised for 'Facebook' whereas the '@DHWDevelopment' was utilised for 'Twitter'. I included the description on the bio for 'Twitter' as the description for the 'Facebook' page as well to explain about the purpose of each item. The first two images below both show the logo included and colour scheme used. The third image relates to the design used for both cover pages on 'Facebook' and 'Twitter'.
The Logo Used and Created Colour Scheme

'DHW' Logo Utilised

The Created Colour Palette
The Cover Page Design for 'Facebook' and 'Twitter'
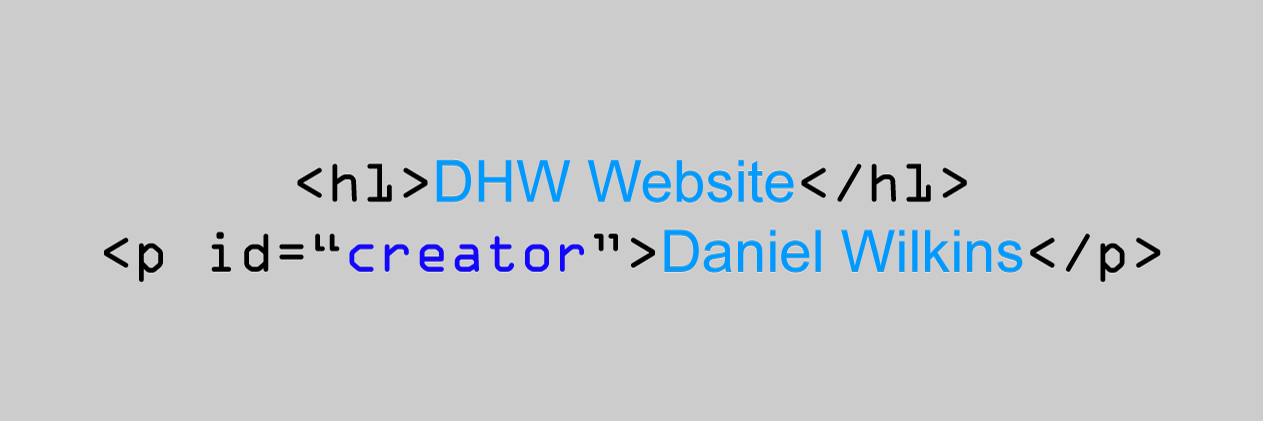
The 'Facebook' and 'Twitter' Cover Page Design
The Established Social Media Accounts
'Facebook'
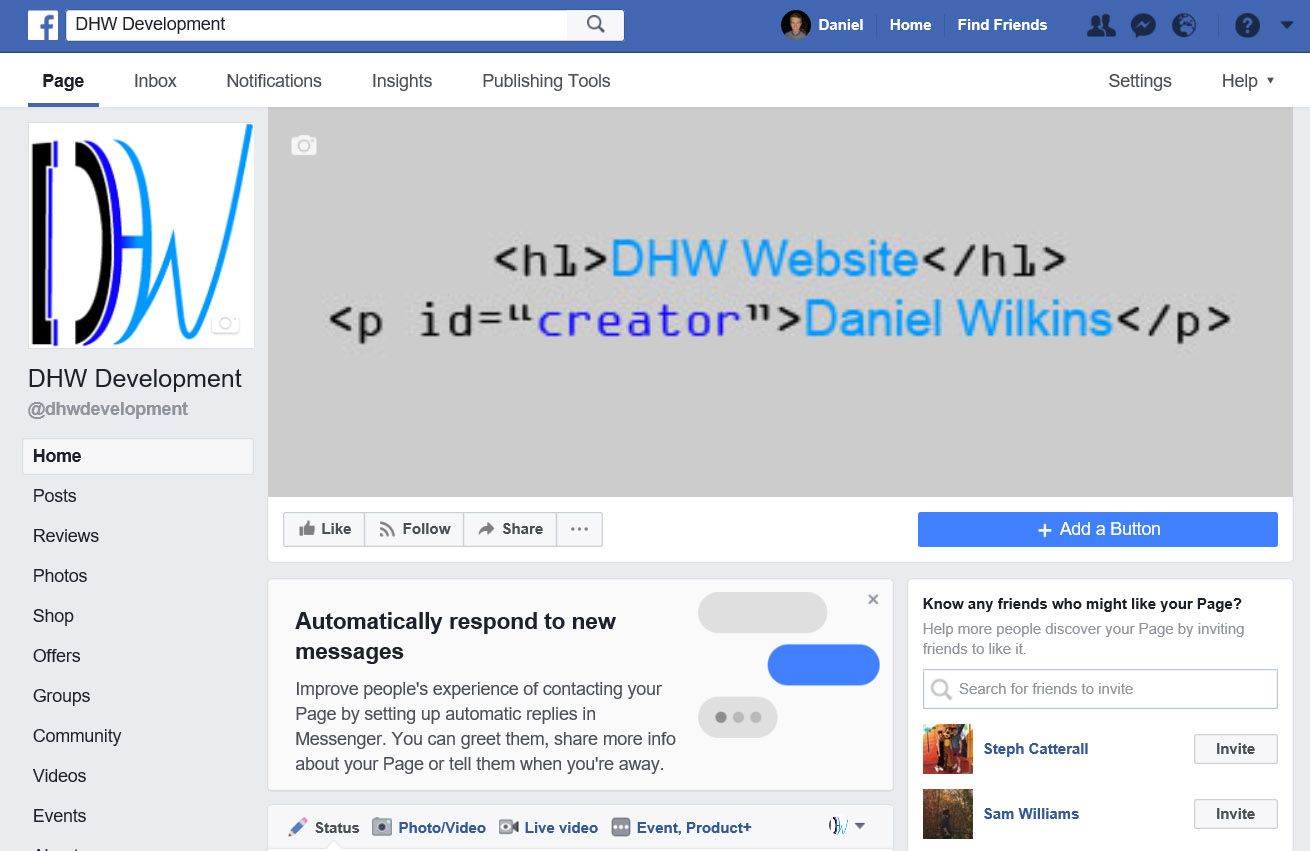
The Established 'Facebook' Page
'Twitter'
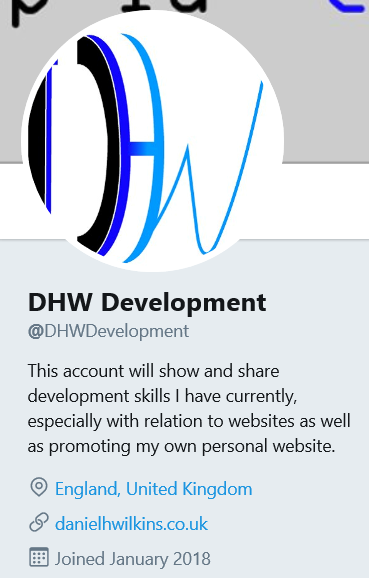
The Established 'Twitter' Page
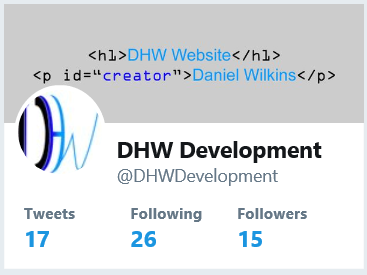
The Established 'Twitter' Page Continued
'LinkedIn'
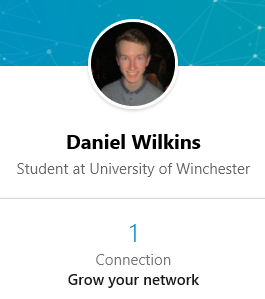
The Established 'LinkedIn' Account
Different Stages of the Campaign
The Day Before the Campaign went 'Live'
Overview
Before the day the campaign went 'live', I released a post across all different platforms notifying those who were following myself at the time that my campaign would have been going 'live' the following day. This can be viewed below.
The Post Relased Across all Platforms
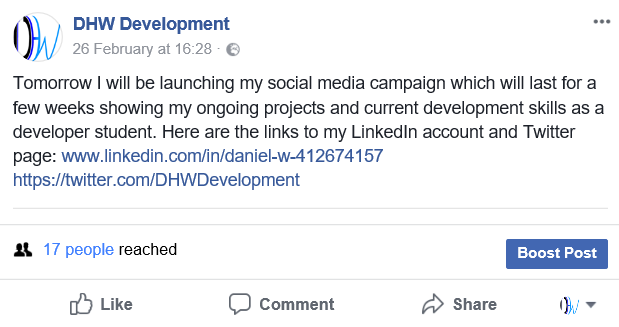
Releasing the Post on 'Facebook'
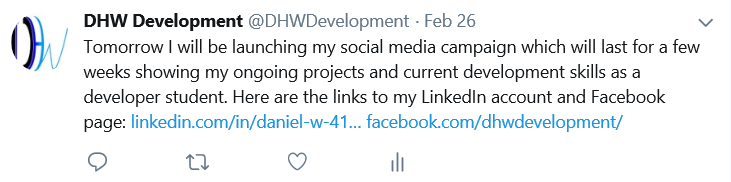
Releasing the Post on 'Twitter'
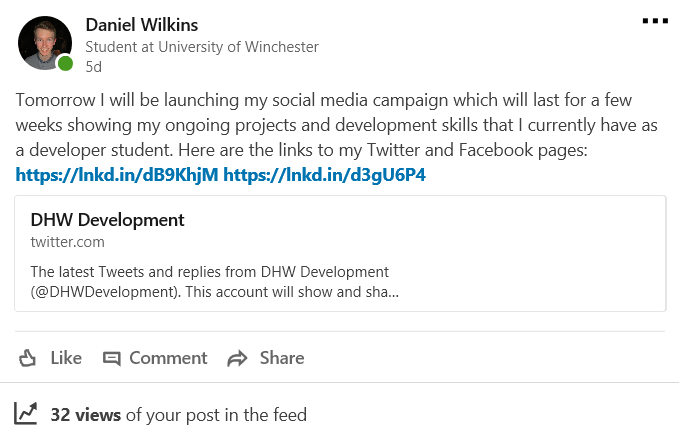
Releasing the Post on 'LinkedIn'
Types of Posts Released
Overview
I released various types of posts with some being curated content from others. Although stated before that I would have focused on different areas of development, I focused on website development as this was an area I had a passion for and something that I was confident in showing during the campaign. I had set myself some 'SMART' objectives for different types of content such as achieving ten likes with at least five comments and three retweets on posts showing examples of my work. To view the full set of these 'SMART' objectives, simply view the action plan situated at the bottom of this page.
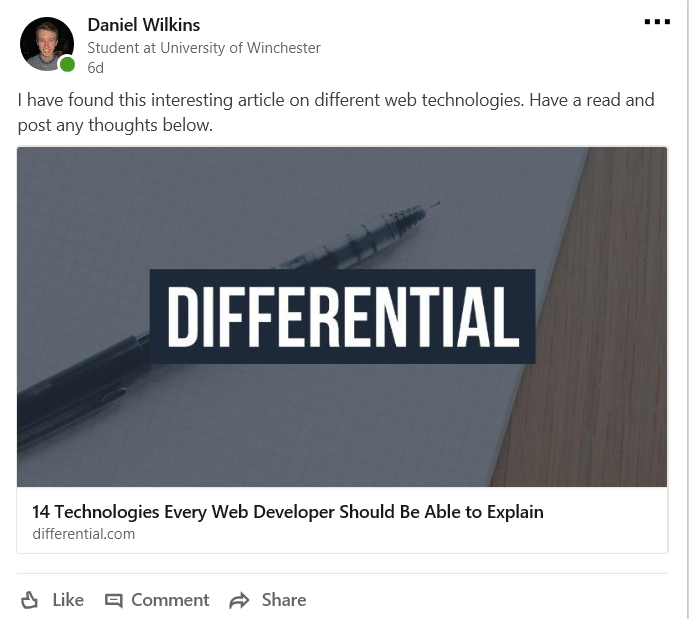
Articles based on Different Areas of Website Development
Overview
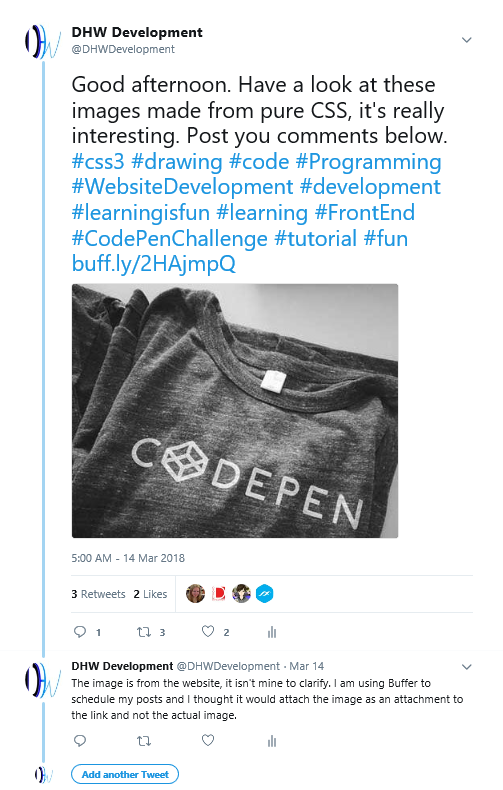
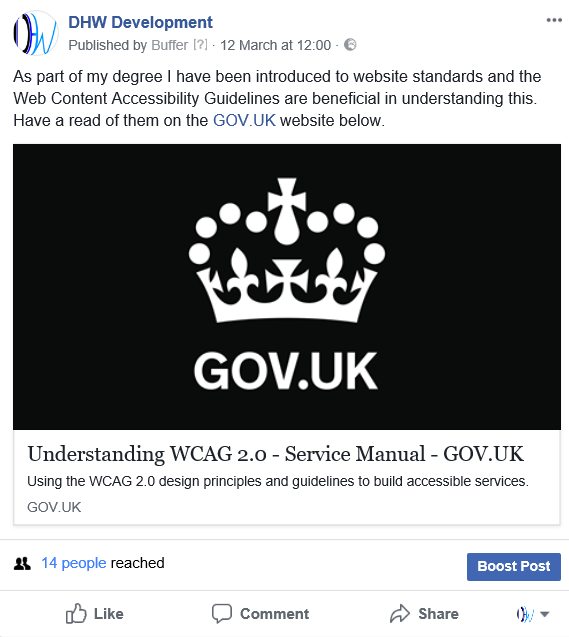
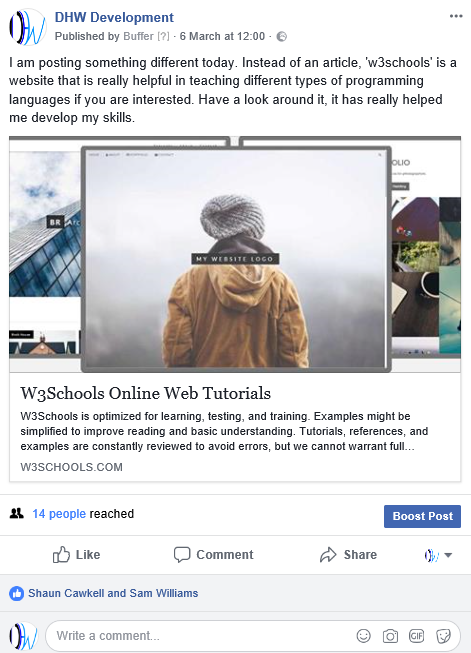
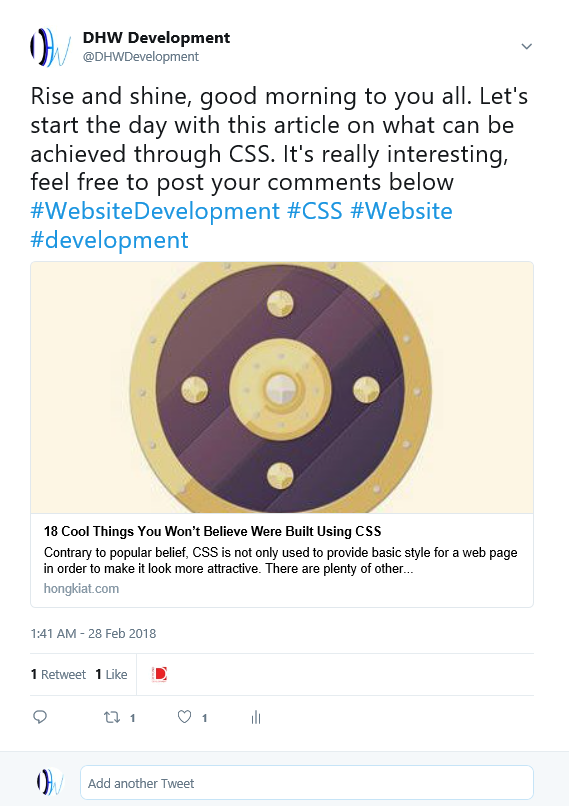
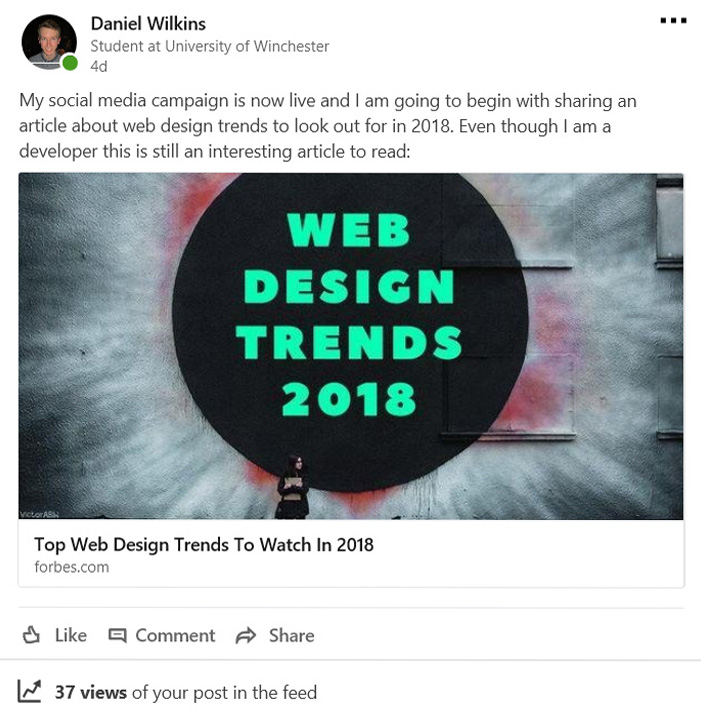
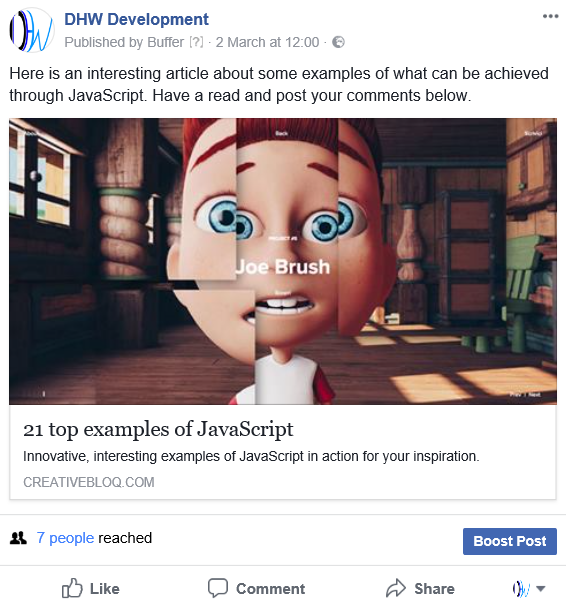
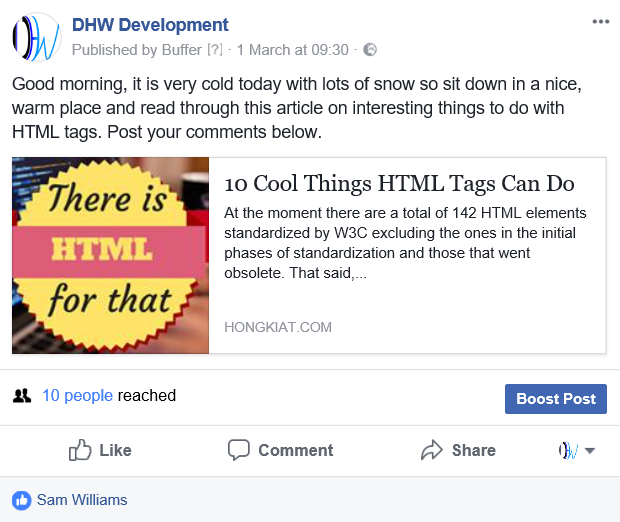
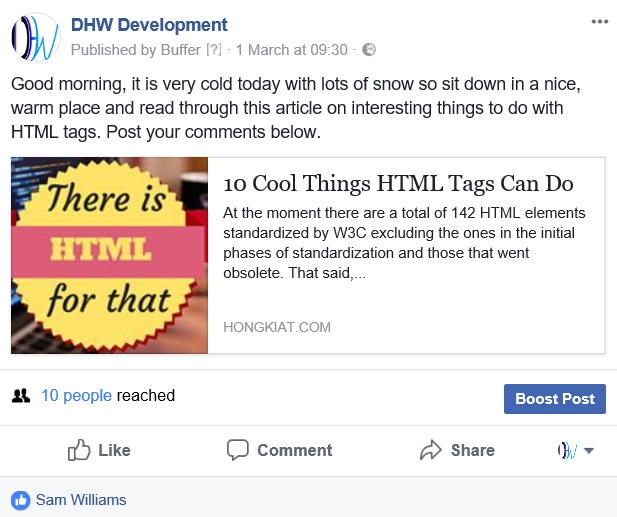
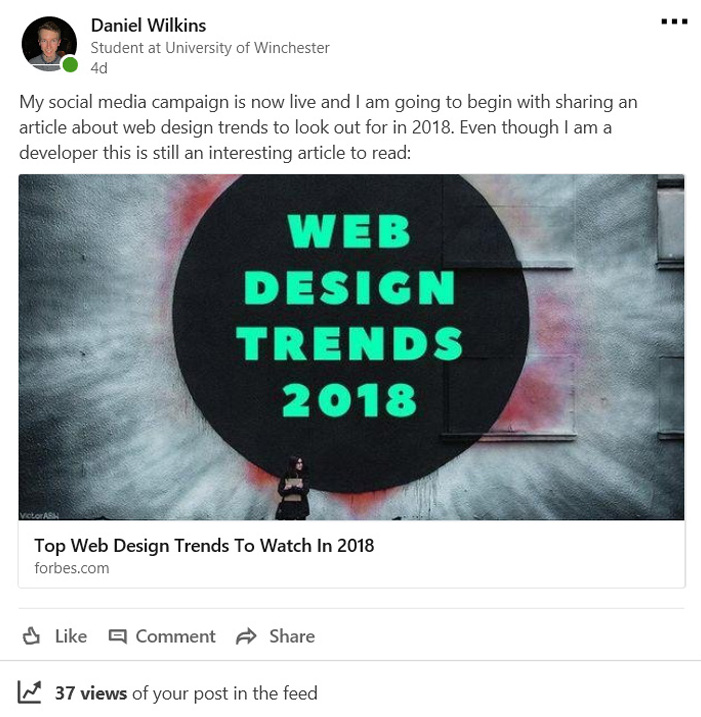
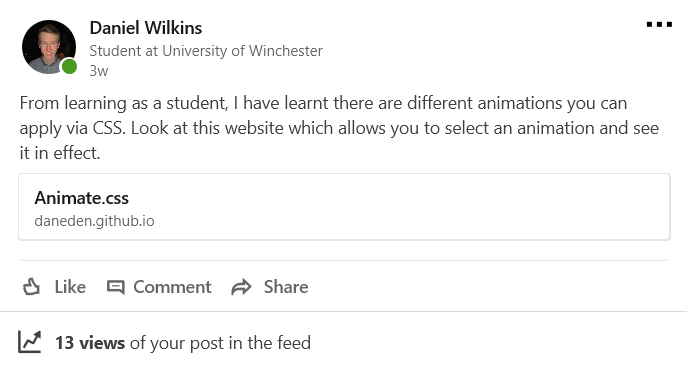
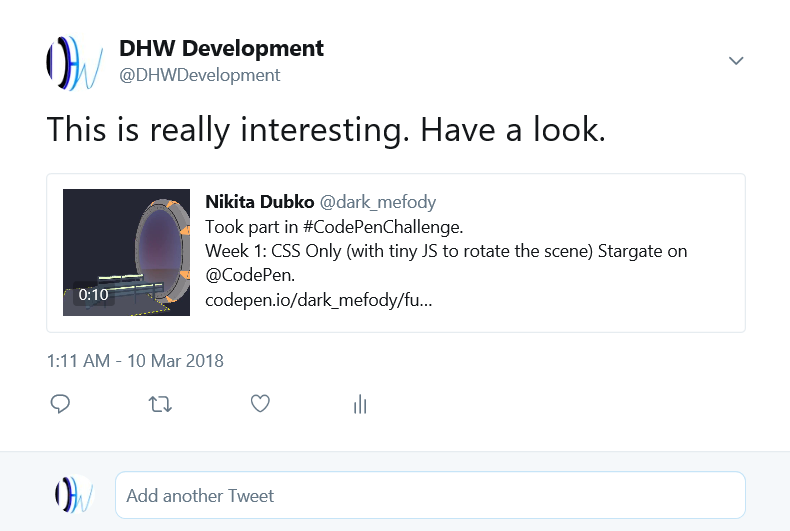
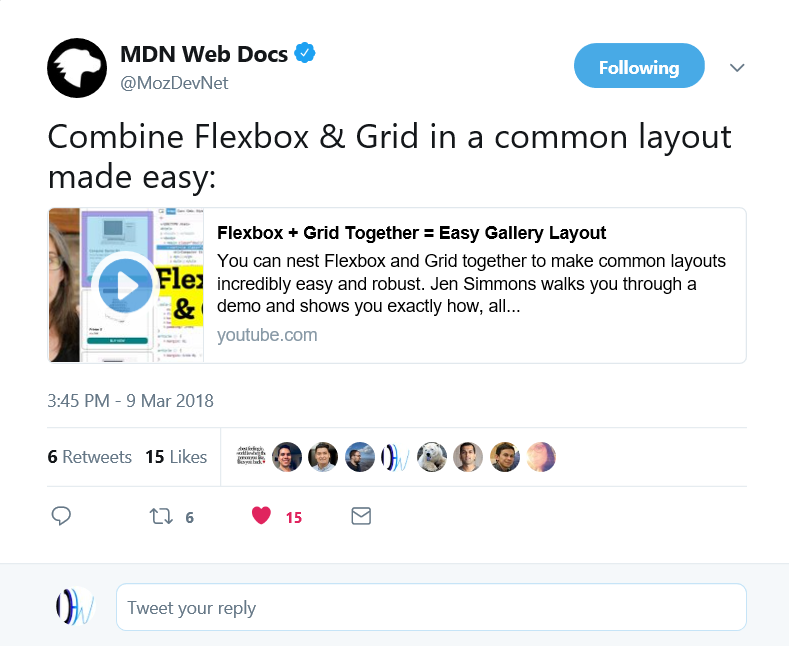
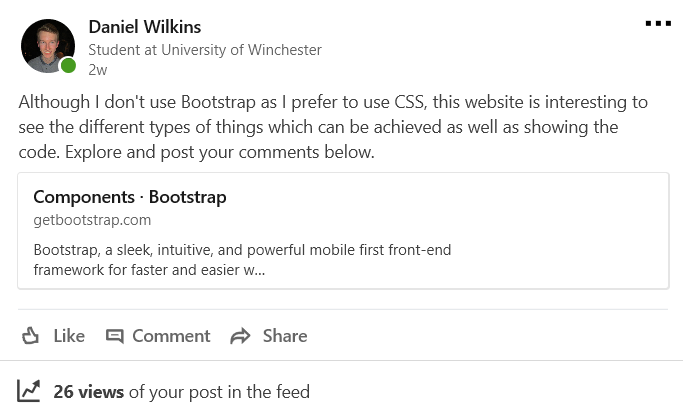
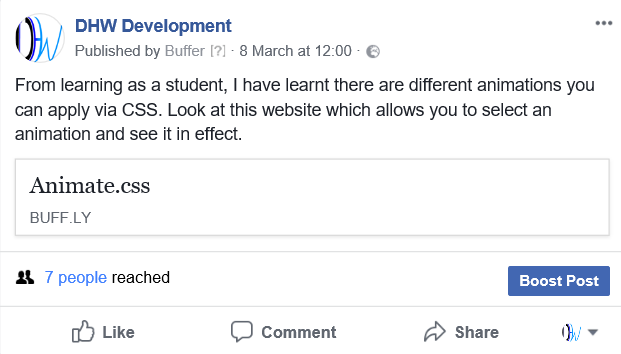
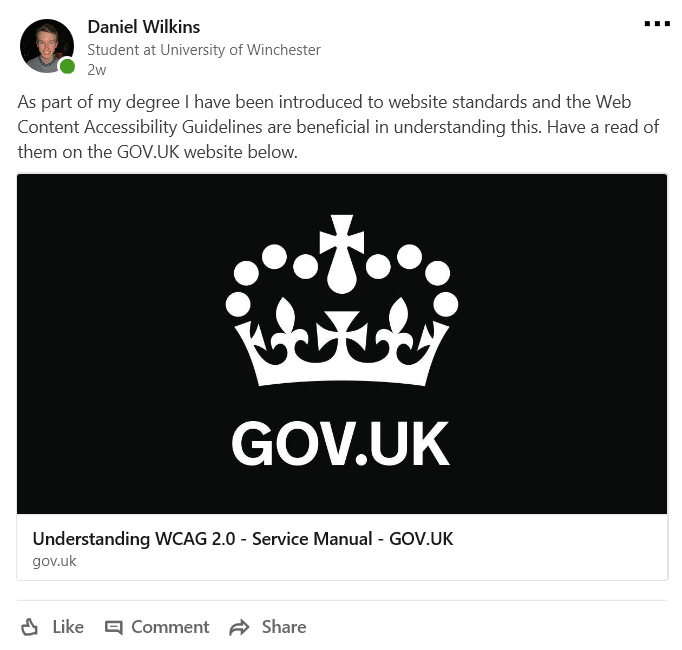
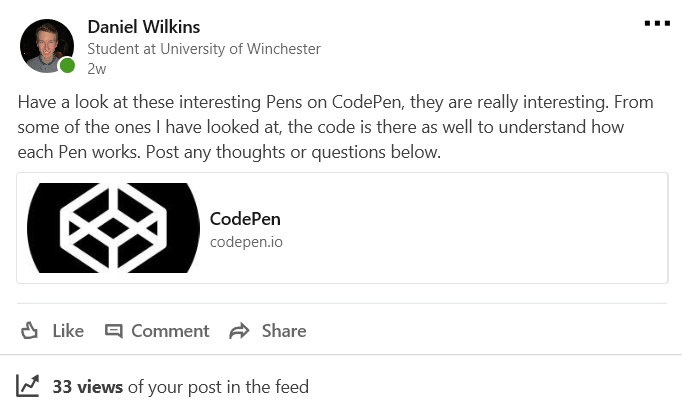
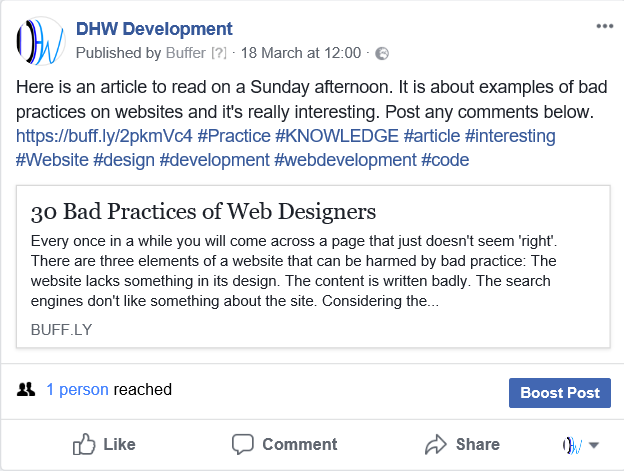
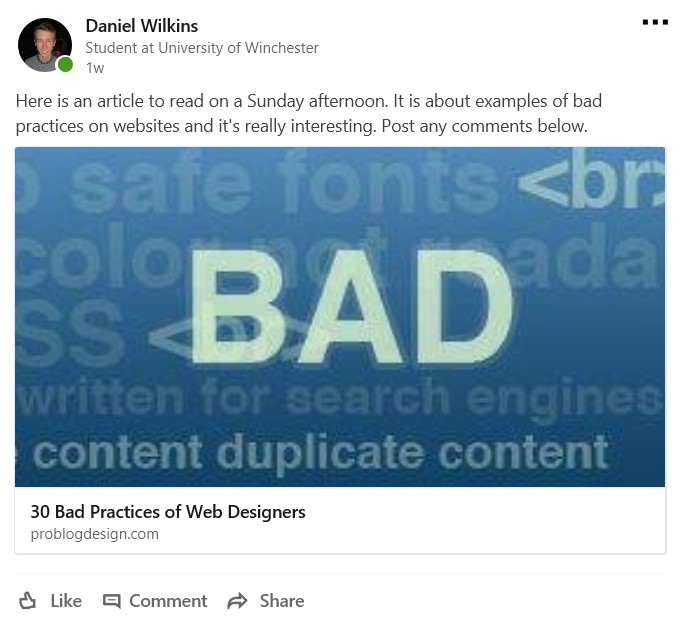
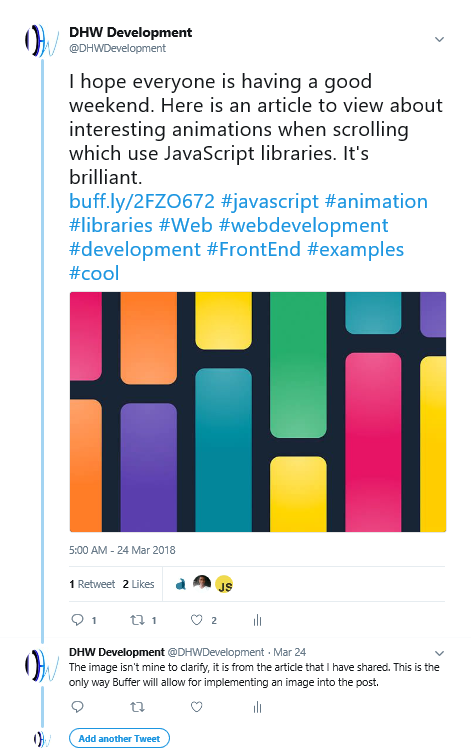
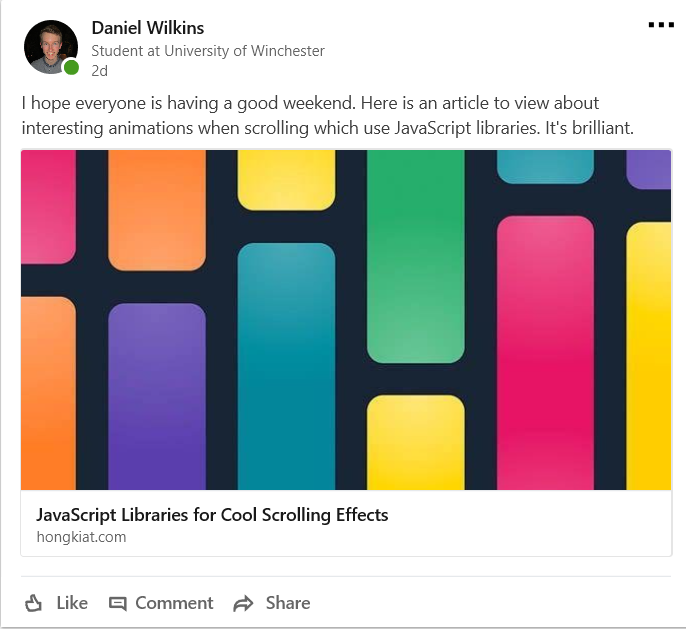
One of the post types I released was website development articles which covered a range of different topics including best practices, interesting things to do with 'HTML', interesting things to do with 'CSS' and trends of website design. This was a type of post curation that I undertook in order to display my passion as well as interests but to also share articles which I believed my followers would have found interesting.
As the campaign developed, I also shared websites as well as interesting areas I had found with regards to work. This was to try and change the content so it wouldn’t have been as predictable.
Examples of these Posts
Examples of Posts
Examples of Posts Continued
Examples of Posts Continued

Examples of Posts Continued
Examples of Posts Continued
Examples of Posts Continued
Examples of Posts Continued
Examples of Posts Continued
Fill in the Blank Activities/Brain Teasers
Overview
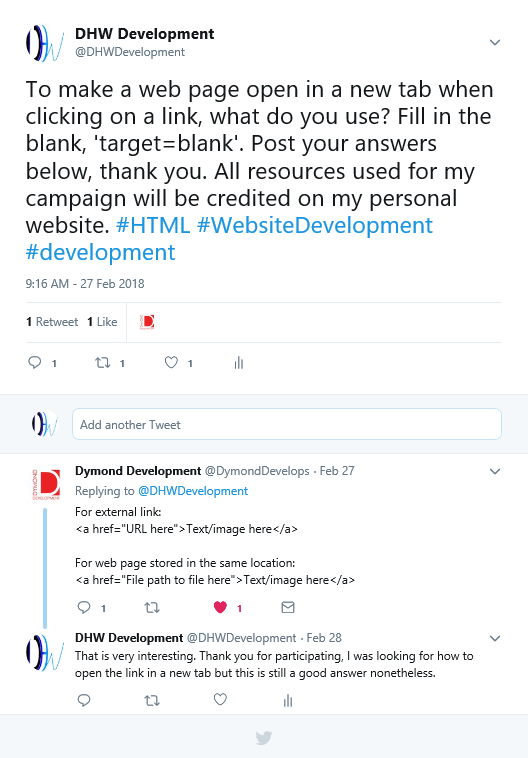
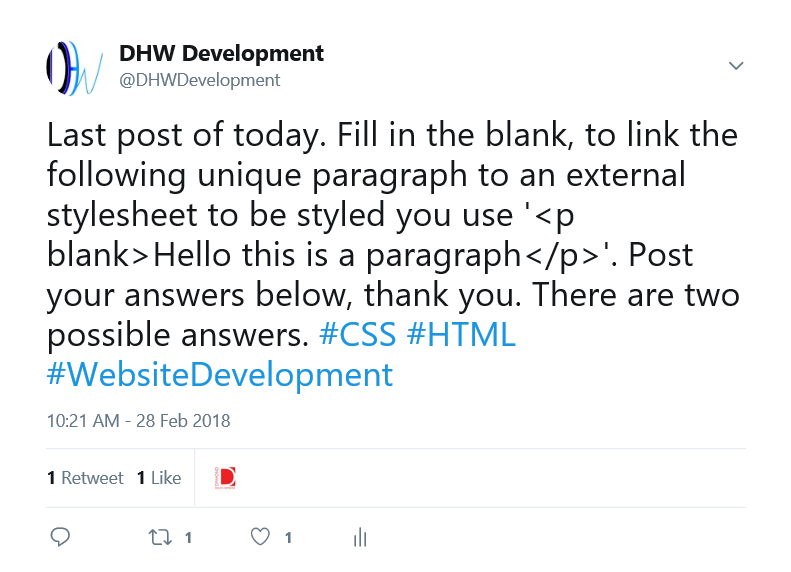
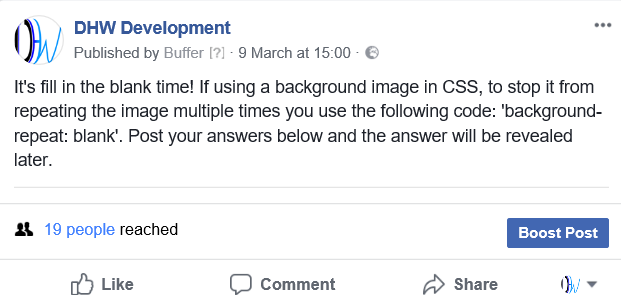
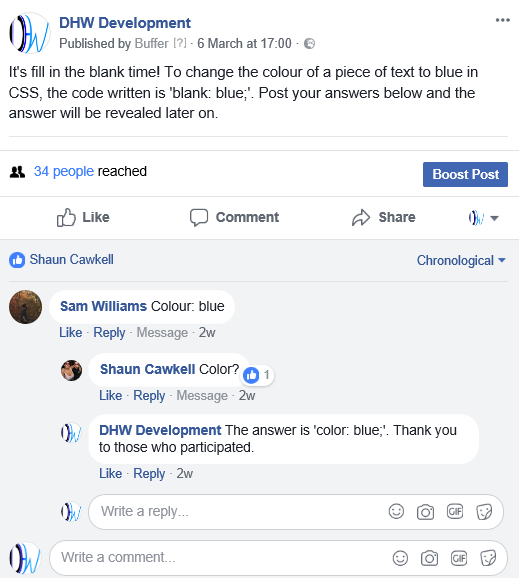
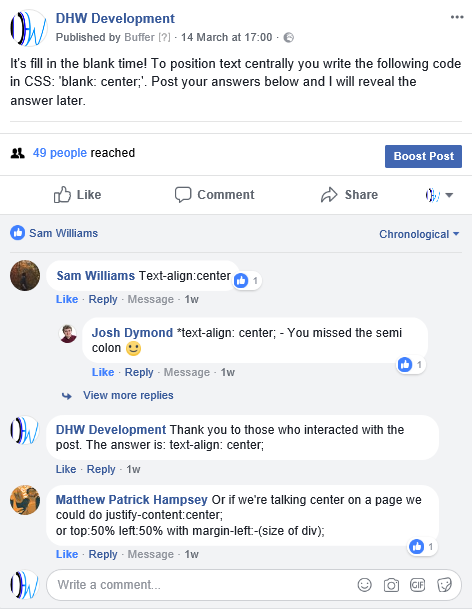
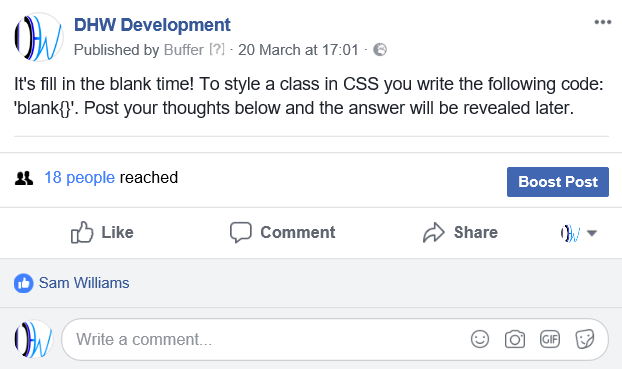
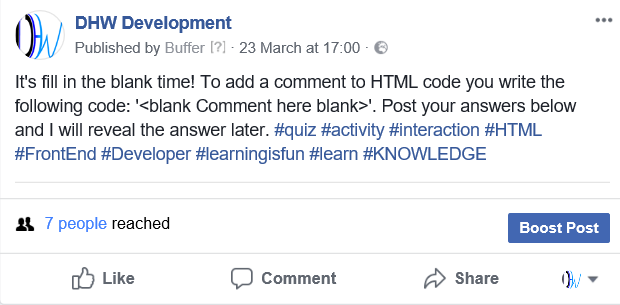
I posted fill in the blank activities to engage my followers to encourage them to learn about code through posting their thoughts of answers of what was missing from a line of code to make it fully function. This was first of all based on 'Twitter' but I broadened this to 'Facebook' in the later stages of the campaign as a technique to encourage more interaction.
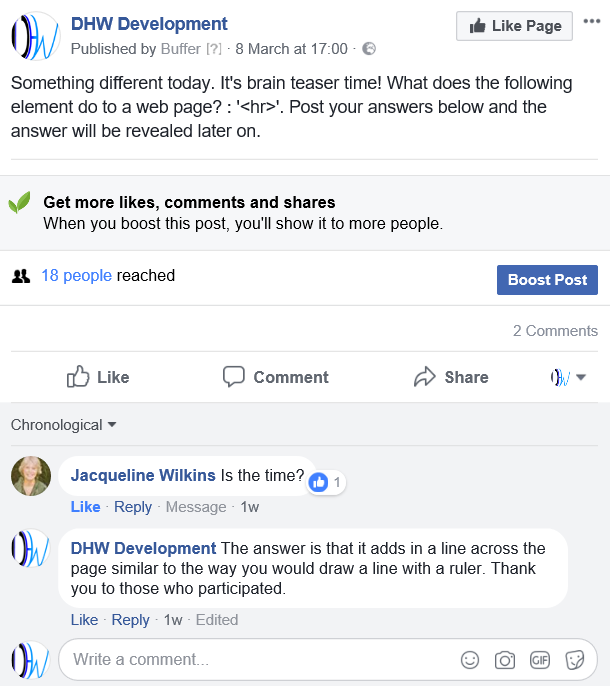
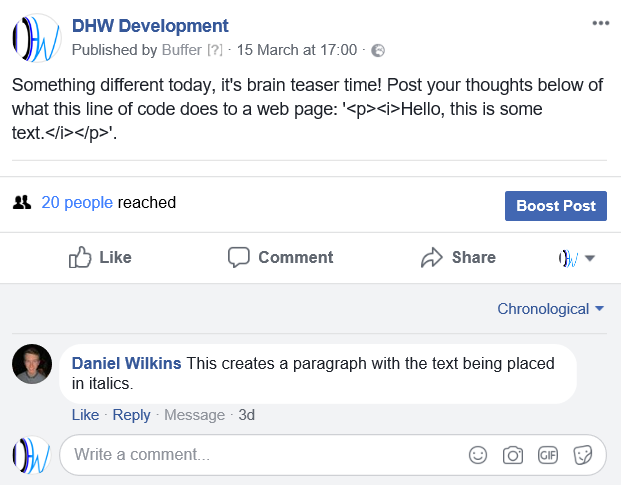
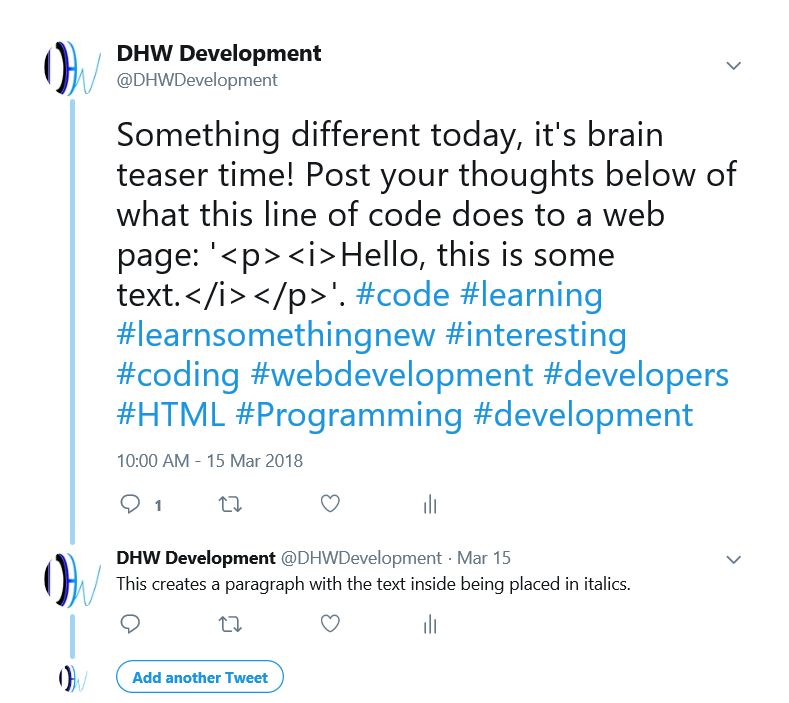
I also occasionally posted brain teasers which had the same concept but asked users to post answers on what they believed a piece of code to do that had been written on the post. Both post types can be viewed below.
As is evident below, I always tried to respond to any answers given by followers to show that I cared about their thoughts and to make them feel involved. Most of the time I didn’t manage to release the answers due to the fact that I didn’t receive any interaction on some posts. When I had received interaction, I liked the participants comments and responded to their comments as well.
Examples of these Posts
Fill in the Blank Activities Examples
Fill in the Blank Activities Examples Continued
Brain Teaser Examples
Brain Teaser Examples Continued
Information about Current Projects
Overview
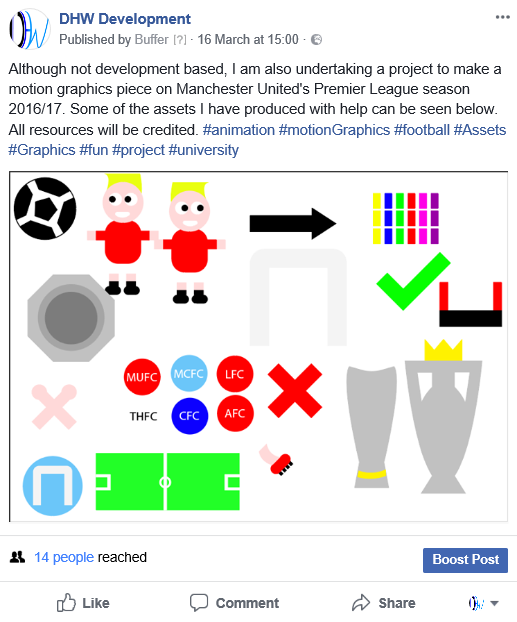
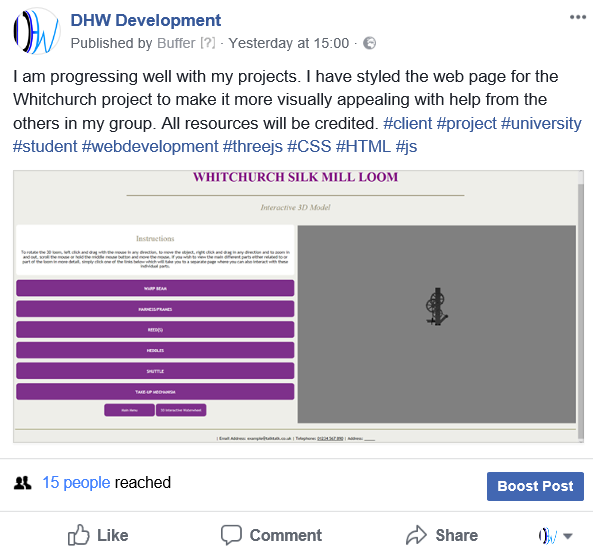
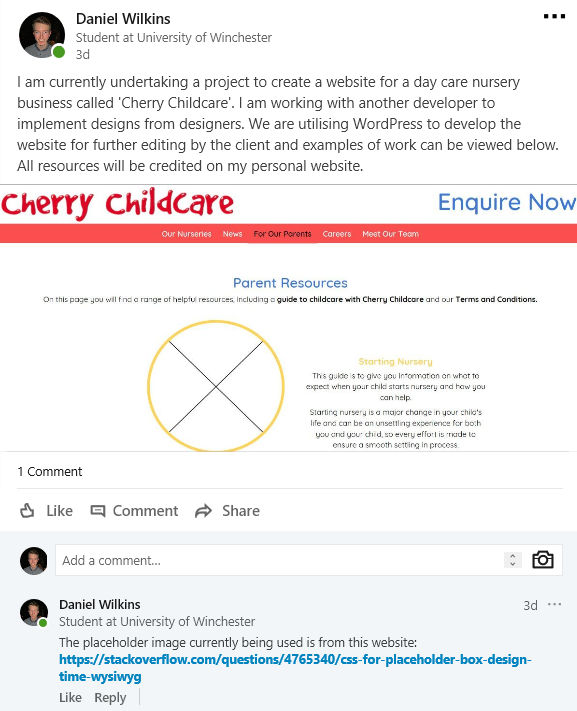
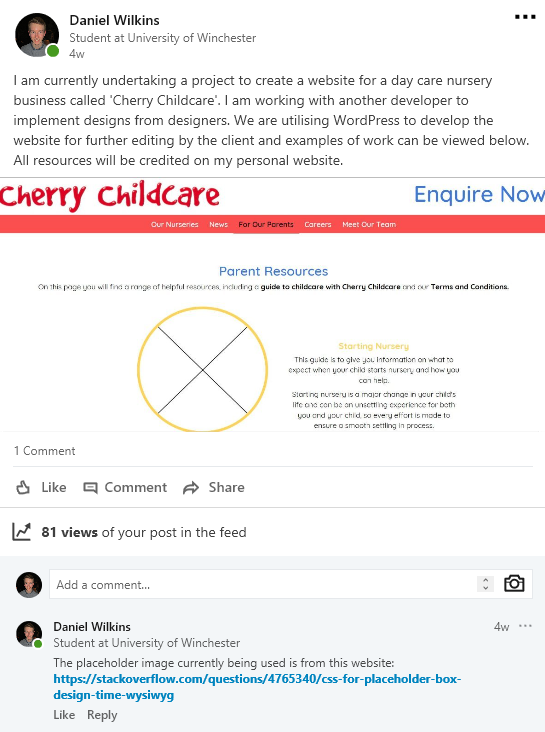
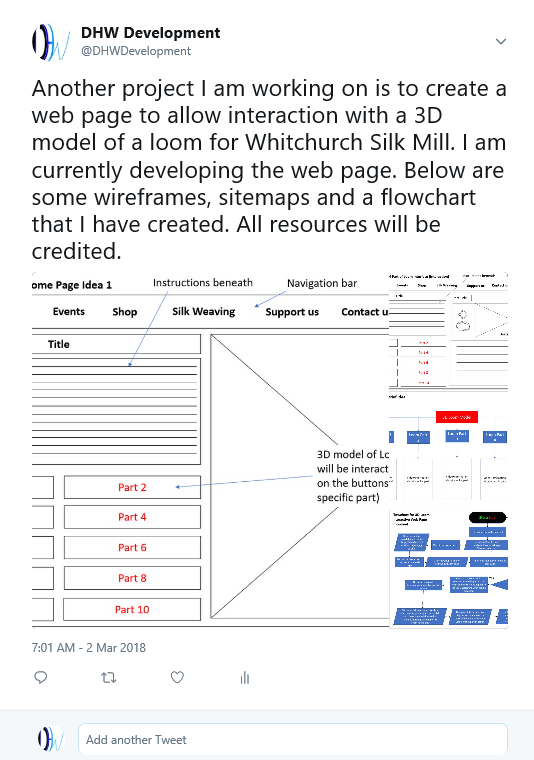
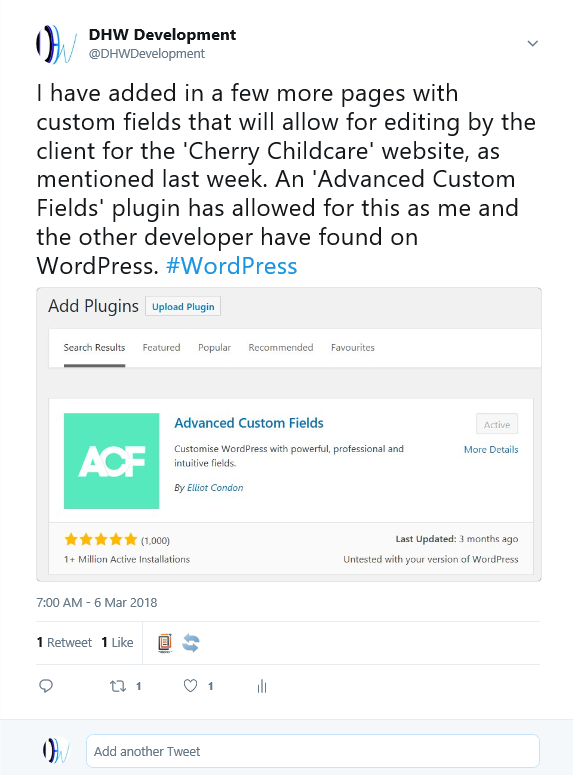
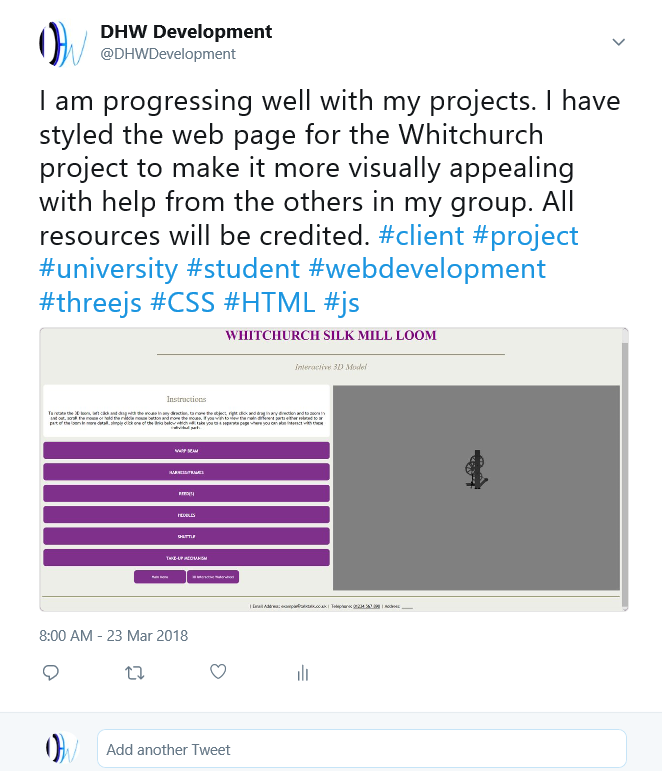
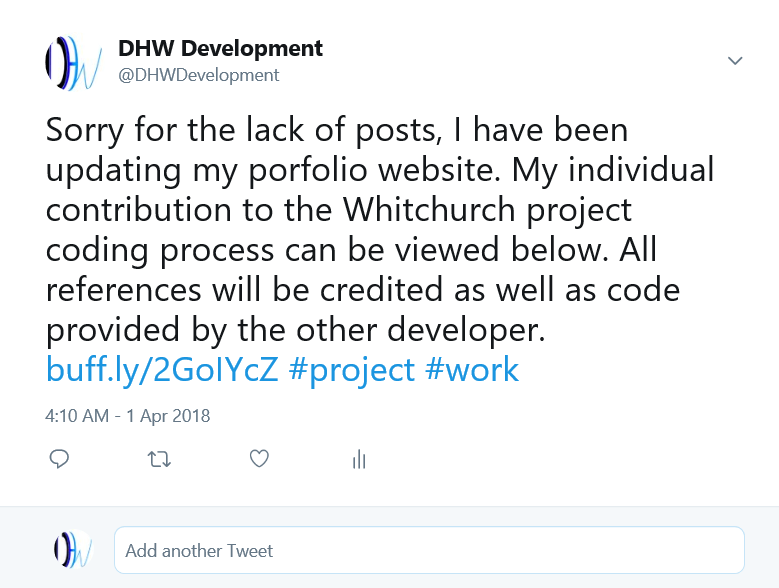
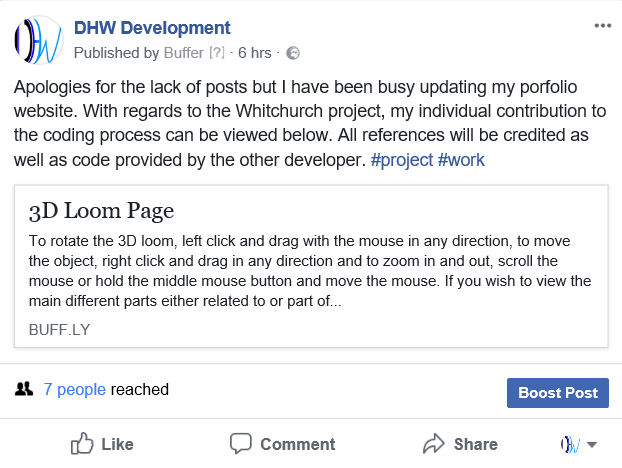
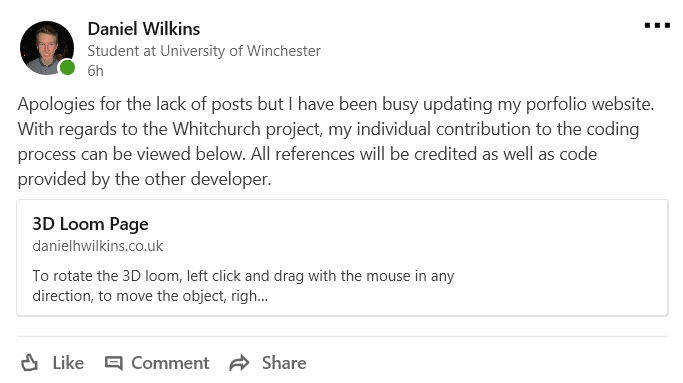
Occasionally, I would release updates or information on some of the projects I was undertaking at the current time. This would have included screenshots of the work I had been making as well as interesting aspects I had found or learnt whilst undertaking the projects. This can be viewed below.
As is evident below, I tried not to include too many images within the posts to allow for the followers to gain a basic understanding of the types of work I was undertaking. This was also due to the fact that 'LinkedIn' only allowed for posting of one image in one post at a time so therefore I tried to make this consistent across all platforms.
Examples of these Posts
Post 1
Post 2
Post 3
Post 4
Made Examples of 'CSS' Animations
Overview
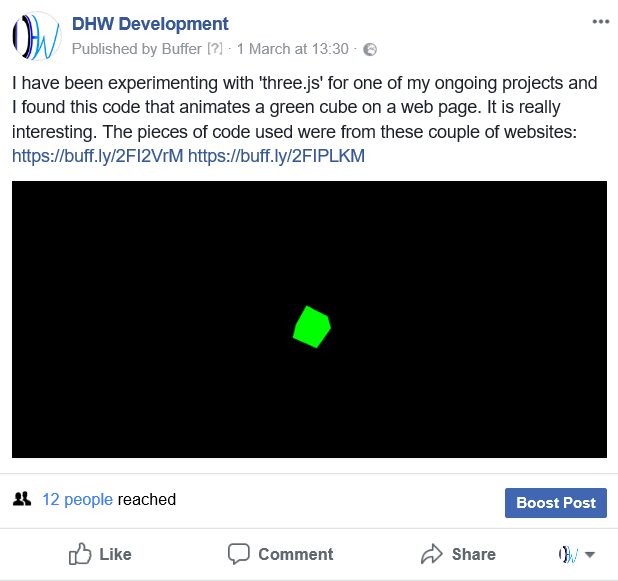
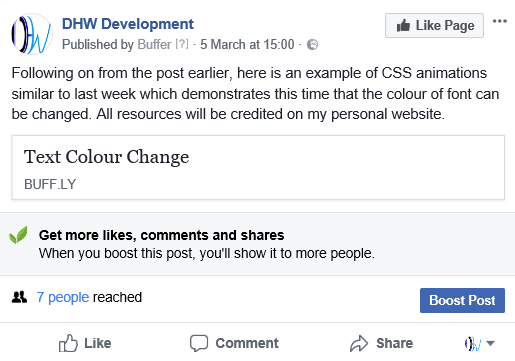
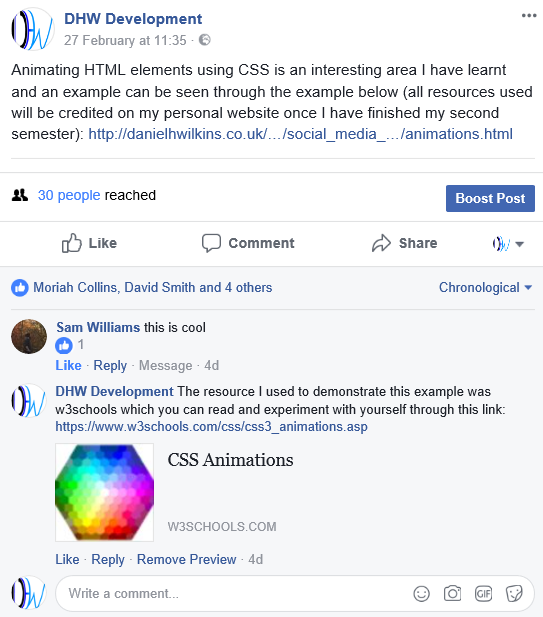
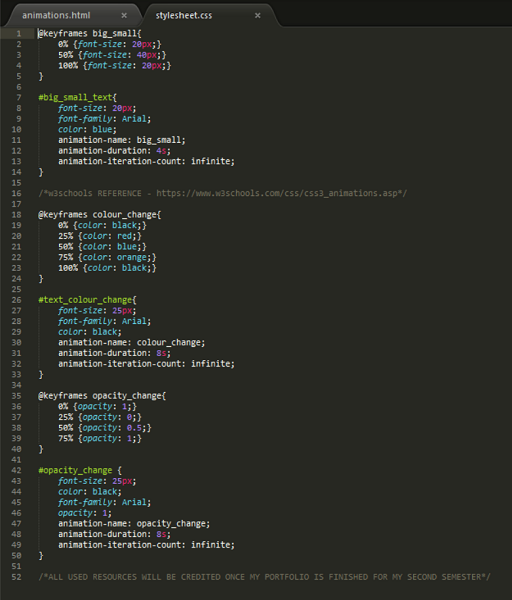
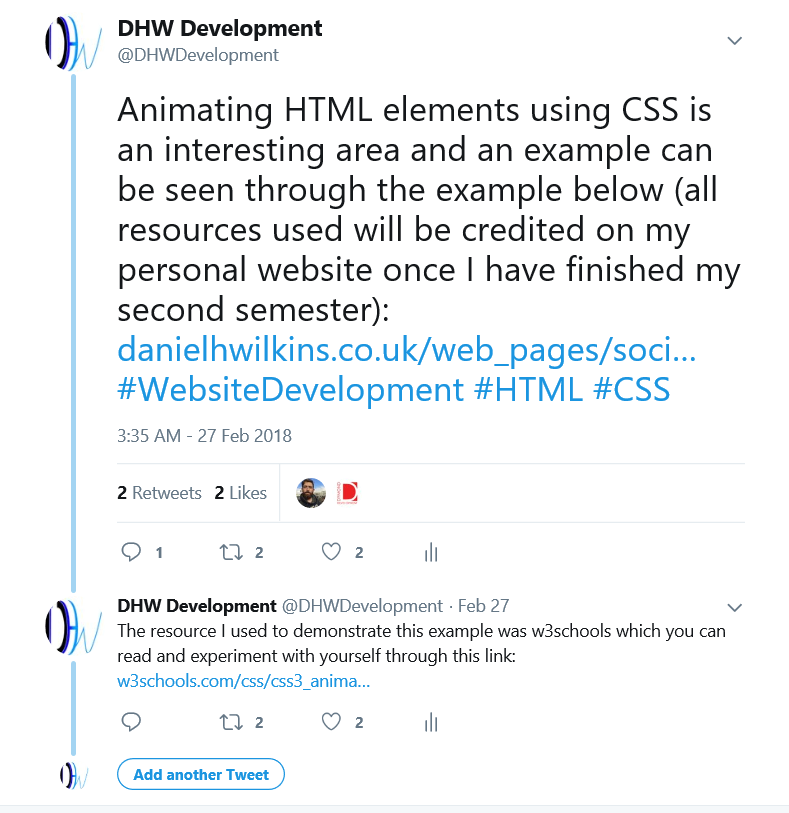
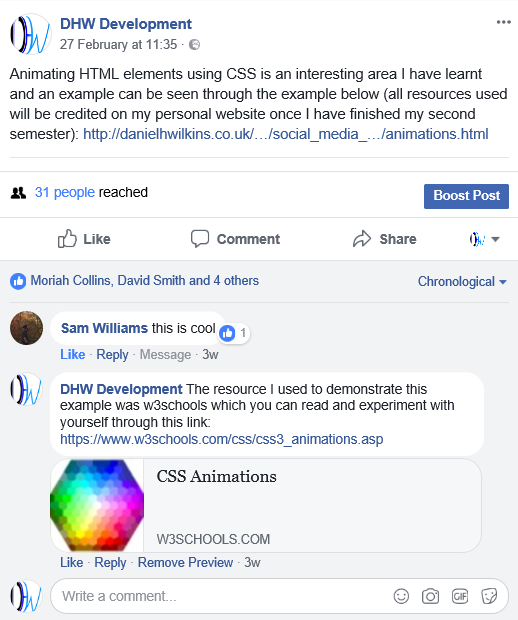
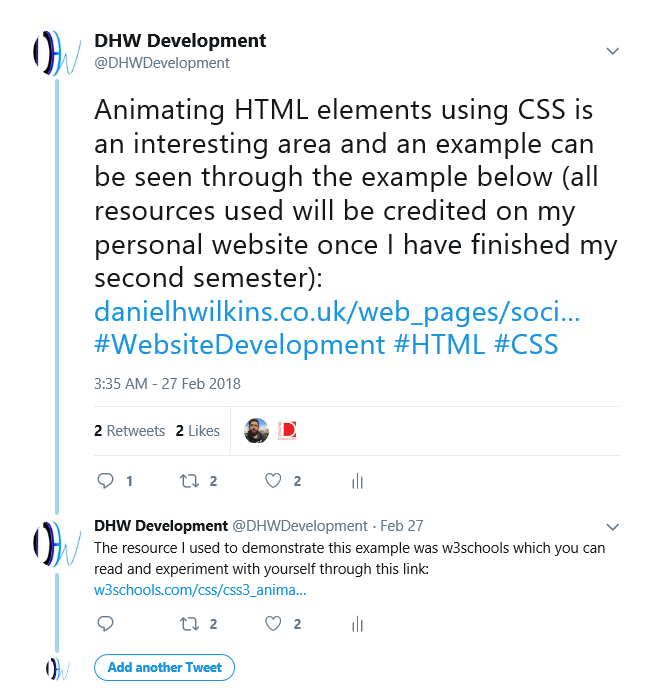
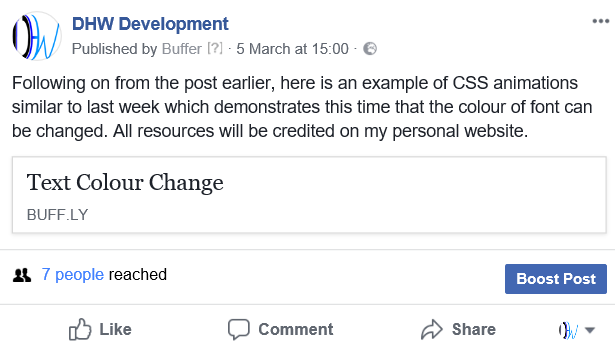
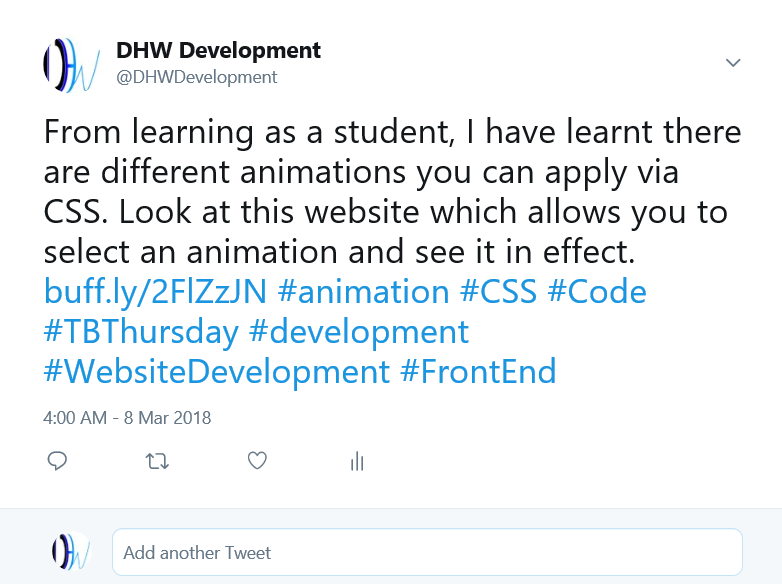
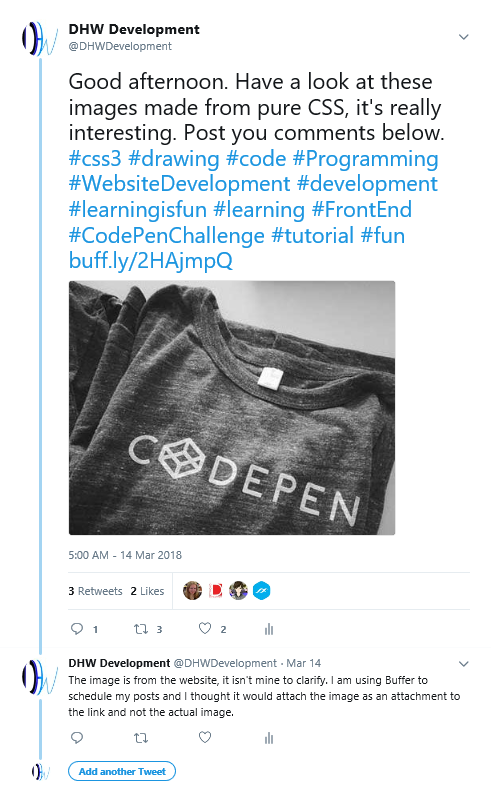
A few times during the campaign I released web pages made with the help of resources such as ‘W3Schools’ which demonstrated the interesting things one could do with 'CSS' animations through the use of ‘@keyframes’. This was to attempt to show my knowledge and understanding of code but to also make it interesting for the followers to view. This can be viewed below.
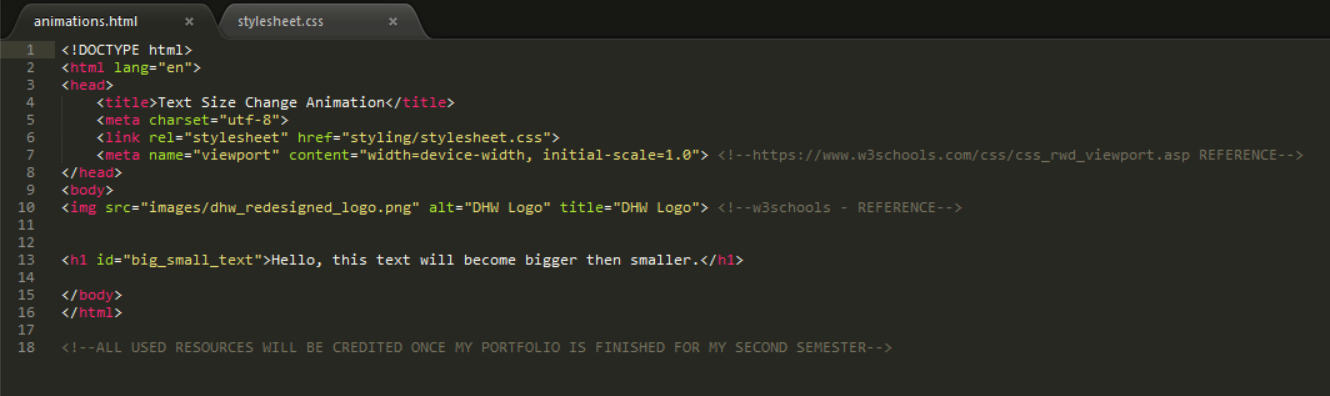
The first example displayed the fact that the text would have resized, becoming smaller and then bigger continuously. The second example would have also continuously looped but this time, the colour of the text would have changed rather than the size. The last image showed the 'CSS' code relating to all pages in order for the animations to function properly.
The outcomes can be viewed under the examples via the provided links.
Example 1 of this Type of Post
The Post for Example 1
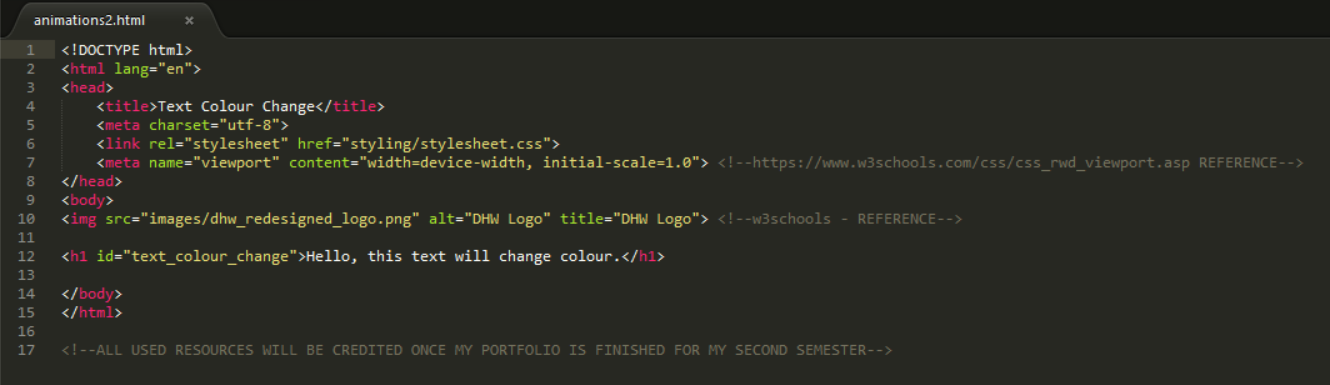
The 'HTML' Code for Example 1
Example 2 of this Type of Post
The Post for Example 2
The 'HTML' Code for Example 2
The 'CSS' Code
The 'CSS' Code for all Animations
Miscellaneous Posts
Overview
There were a few times during the campaign where posts were released by inspiration. These can be viewed below.
The first post was to help with a case study I was currently undertaking at the time as I thought I could have received some feedback from industry professionals on the user experience of a prototype I had made during the last semester for the 'RSA' project. This would have also showed some work I had completed previously which would have shown the areas I had been learning about whilst undertaking my degree or work in general.
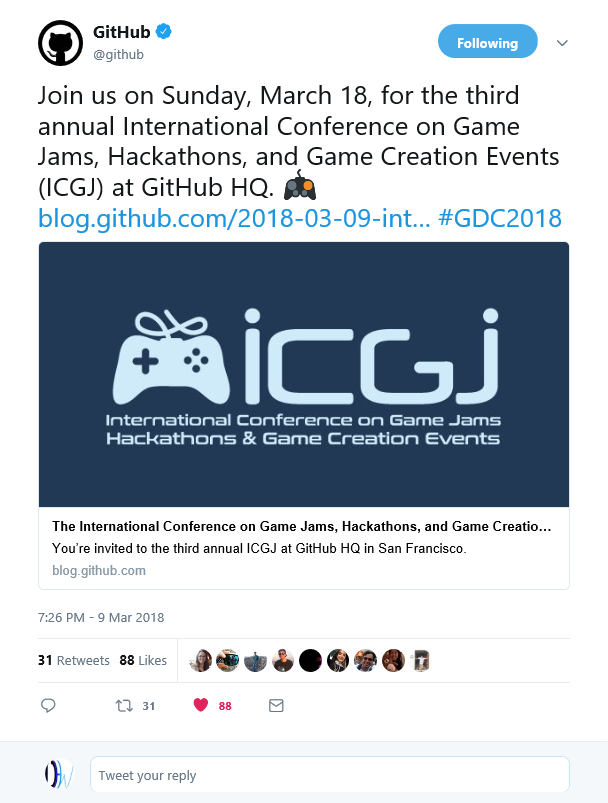
The second miscellaneous post was sharing an event which stated when 'Transmedia 2018' would have occurred. This was to help promote the event and this was shared through 'Facebook'. I also then followed 'Transmedia 2018' on 'Twitter' to help promote the event.
Miscellaneous Post(s) 1
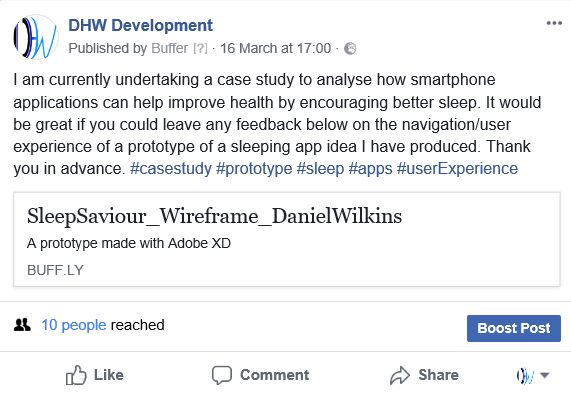
The Post on 'Facebook'
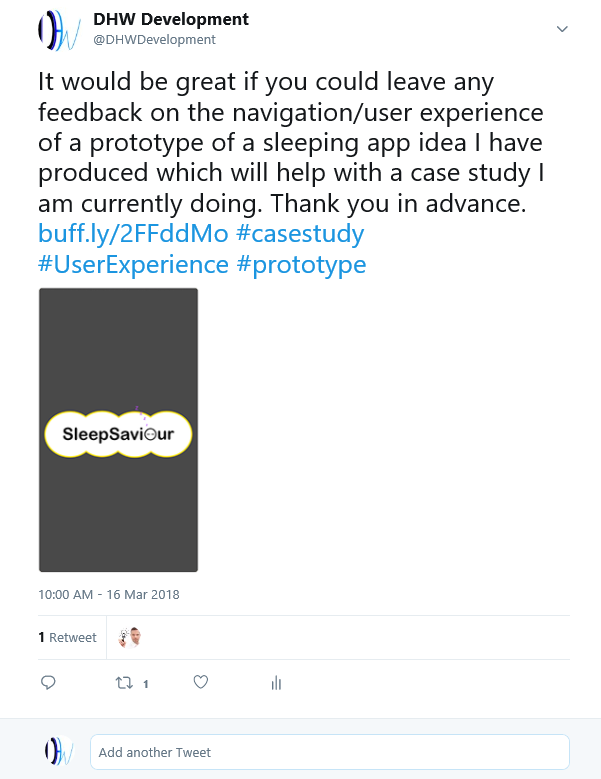
The Post on 'Twitter'
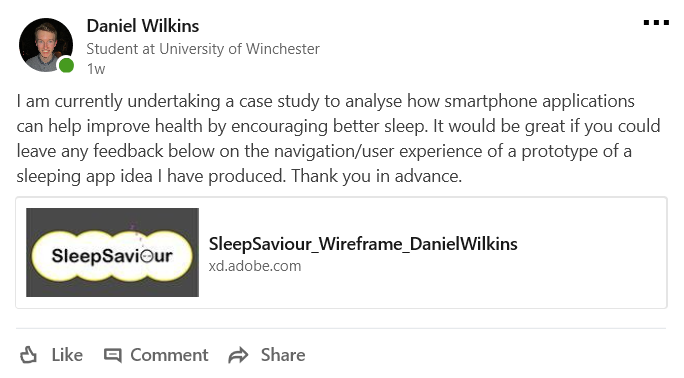
The Post on 'LinkedIn'
Miscellaneous Post(s) 2
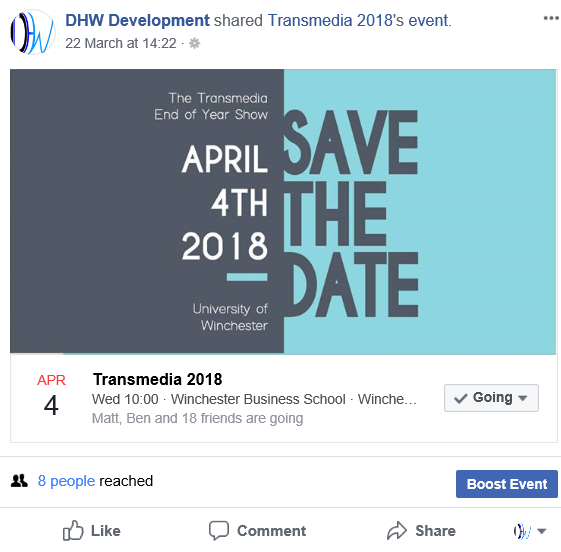
The Post on 'Facebook'
The Post on 'Twitter'
A Physical Collateral Method/Marketing Method
Overview
As well as posting content on each social media platform, I also had to undertake a physical method for one of the weeks. This involved finding a company/agency in Winchester which would have been of interest to myself and thinking of something which I could have either given to them in person or have sent in the post. This was to help improve my status within Winchester as well as improving my social media campaign. The purpose was to persuade them to visit my social media pages as well as my website in order to gain interest.
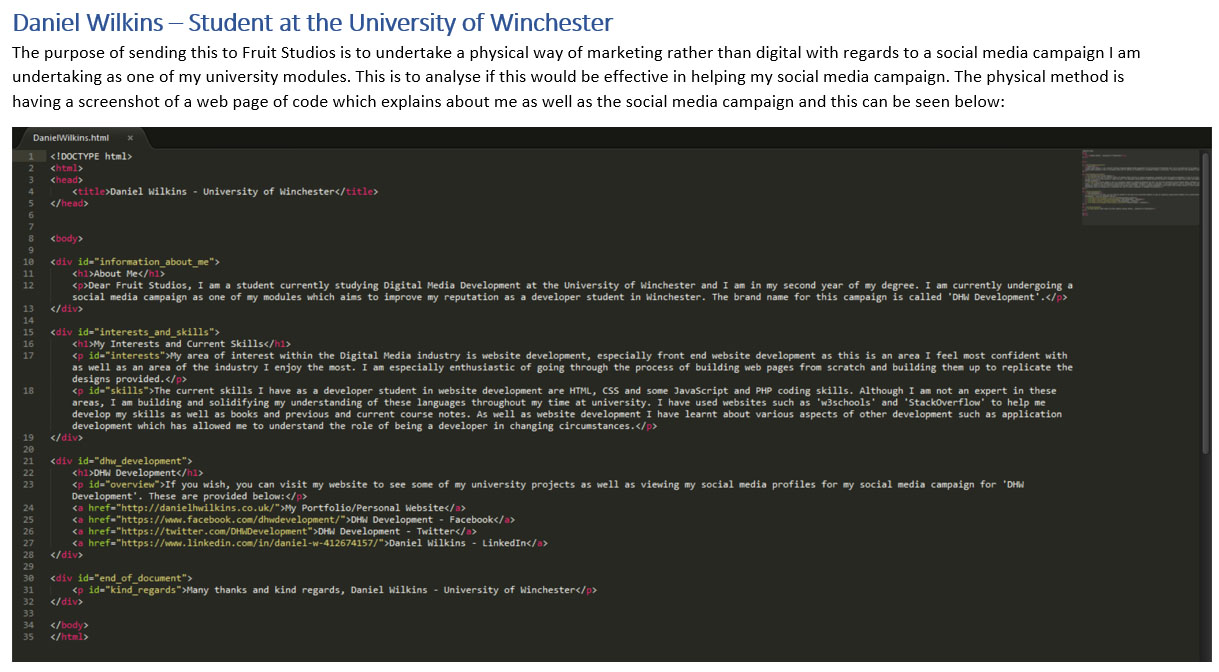
I decided to choose ‘Fruit Studios Ltd’ because I had noticed that they specialised in both websites and apps, of which website development was of a serious interest to myself. I decided to send a screenshot of a 'HTML' page which described and explained about myself and my social media campaign, demonstrating I had knowledge of code as well as showcasing my skills. As can be seen below I included special techniques such as including each section with a ‘div’ ‘id’ that would indicate what the section explained. For example, the 'information_about_me' 'div' related to details about myself, including the purpose of the physical method for the social media campaign.
As advised by the lecturer, I also had to follow the company on 'LinkedIn' as well as connecting with the people in that organisation as this would have allowed for meeting them at possible networking events in the future. This would have then promoted my status even more.
Unfortunately, this method didn't have any impact on the social media campaign but at least I had promoted myself.
The Physical Method sent to 'Fruit Studios Ltd'
The Actual Screenshot of the 'HTML' Page Method
Thanking Followers and Asking for Feedback
Overview
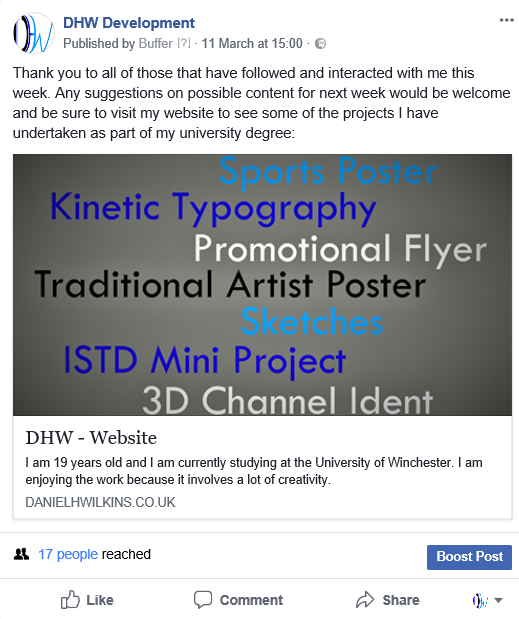
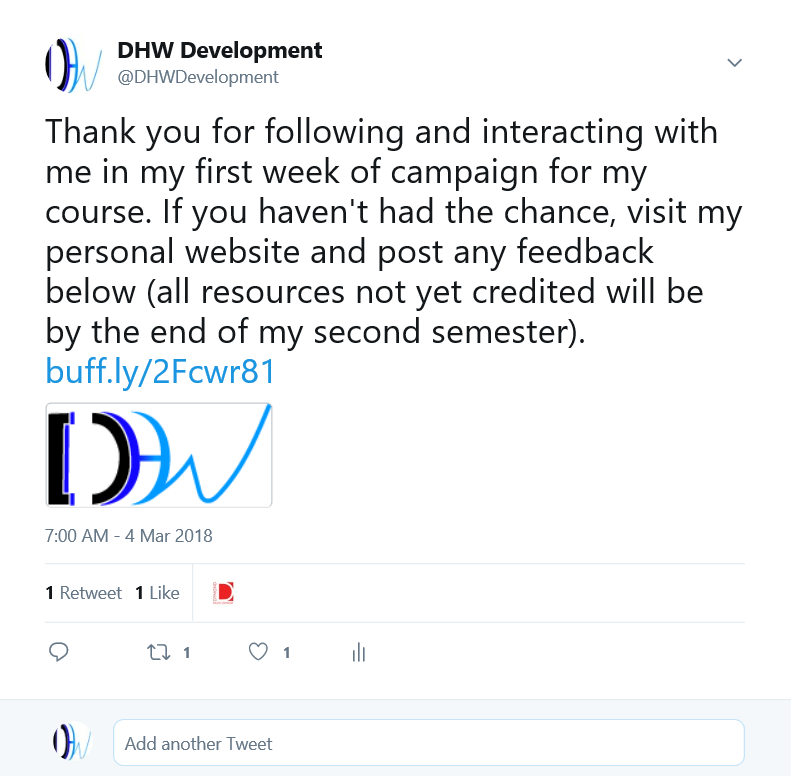
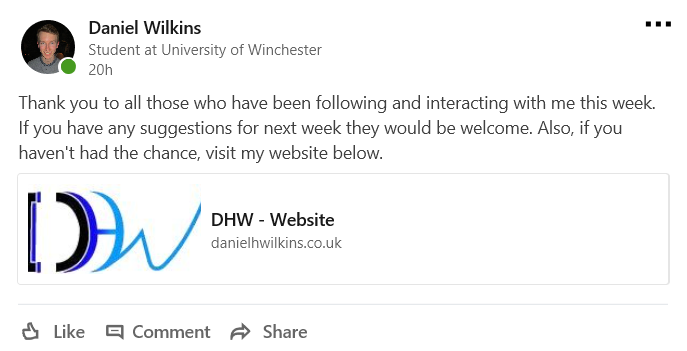
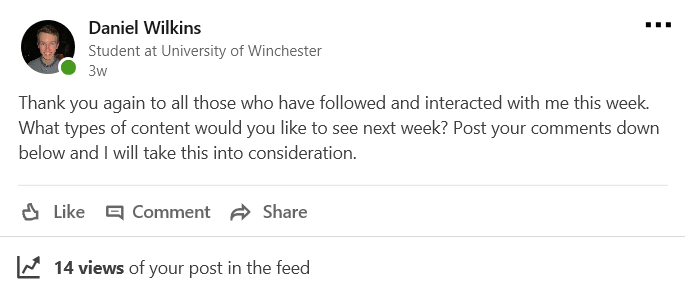
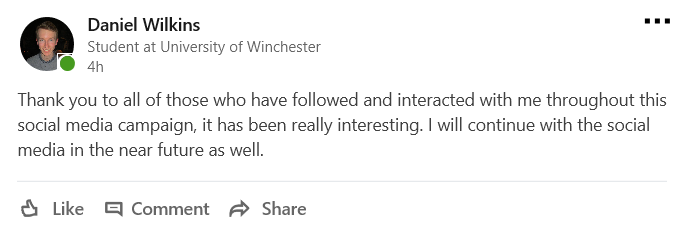
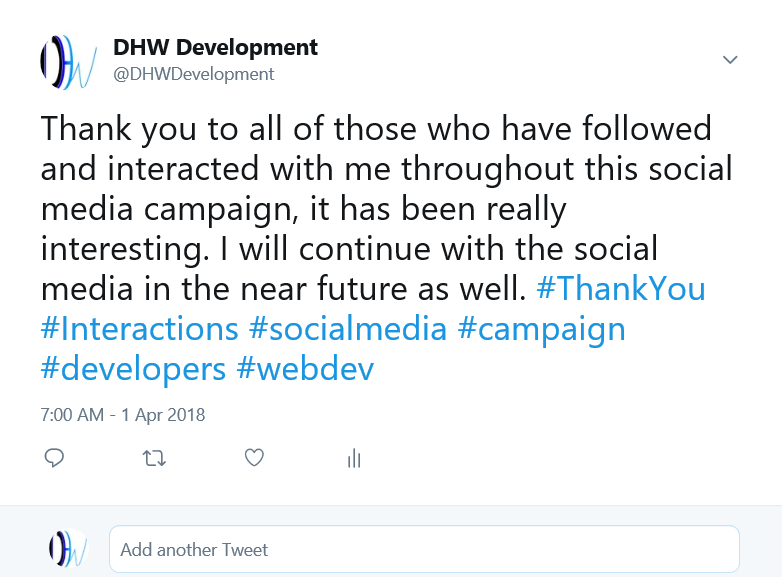
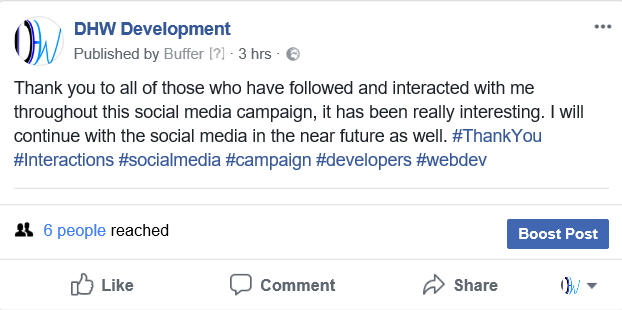
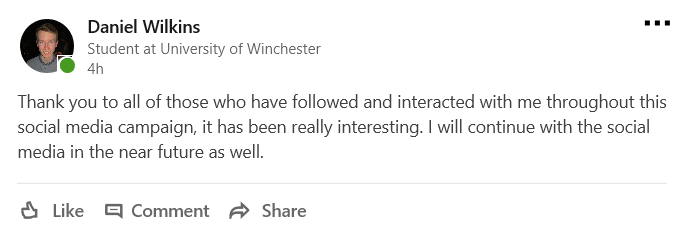
Although this hasn't been included in the 'Types of Posts Released' section, I also released a weekly post which would have thanked followers for following and interacting with the campaign as well as asking for types of content they would have preferred to see in the following week. I thought this would have added a more personalised tone to the campaign.
This was completed on a Sunday even though my campaign started on a Tuesday as this was the end of the week for my followers. I also provided a link to my website to persuade them to visit it and view my work which would have attempted to have increased the amount of views received upon my website as this was one of my objectives. During some of the weeks, this wasn't undertaken due to time constraints.
Examples of this can be viewed below.
Examples of these Posts
An Example Posted on 'Facebook'
An Example Posted on 'Twitter'
An Example Posted on 'LinkedIn'
Creation of Weekly Content Plans
Overview
I always ensured I had a weekly content plan to follow so that I would have known what I would have been posting at specific times on different platforms. When possible, this was completed on a Sunday because this was the end of the week where I would have had more time available to create these plans. These can be viewed via the links provided below.
The Weekly Content Plans
Week 2 Content ScheduleWeek 3 Content Schedule
Week 4 Content Schedule
Week 5 Content Schedule
Explanations of the Content Schedules
Week 2
Overview
For week 2 of the campaign, I decided to change the content schedule to implement some aspects I had learnt such as rearranging some of the times to suit the optimal posting times as seen previously as I didn't believe I was receiving much interaction at the time on some posts. Examples are included below. I also removed the fact that I would have undertaken question and answer sessions and join group discussions on 'LinkedIn' as it proved difficult to be able to undertake everything on the schedule.
Examples of Changed Posts
Example 1 of Modified Posts
Example 2 of Modified Posts
Example 3 of Modified Posts
Week 3
Overview
I then created another content schedule for week 3 of the 'live' campaign as from peer advice and evidence on the social media platforms, I believed I was posting too much. I wasn’t receiving much interaction at all and thought that if I tried to post less, this would have helped to increase the interaction as well as attempt to increase my followers as I had noticed that my followers had decreased and were continuing to decrease on 'Twitter'.
To counteract this, I attempted to show an interest in other people’s posts/work by liking and retweeting this content. Also on other platforms, I invited more people to like my 'Facebook' page as well as connecting with more people on 'LinkedIn'.
The Aspects Mentioned Above
The 'Twitter' Followers Decreasing
Example 1 of Modified Posts

Example 2 of Modified Posts
Example 3 of Modified Posts
Example 4 of Modified Posts
Example 1 of Liking Other People's Content
Example 2 of Liking Other People's Content
Week 4
Overview
Although I didn’t manage to create a schedule at the time, for week 4 I did utilise the previous schedule as I thought this was the best way to undertake my campaign at this stage due to the fact that I could have managed with releasing the amount of posts per day as well as due to the fact that I was gaining some more interaction on 'Twitter'. Although the interaction didn’t change considerably with 'Facebook' and 'LinkedIn', I still thought that I would have remained with this strategy to see if it would have eventually increased the interaction on the posts.
Week 5
Overview
For the final week of the campaign, I utilised the same content schedule again as the previous week. Unfortunately, I wasn't able to release many posts at all during the last week due to submission deadlines where other work had to take priority.
Most and Least Successful Posts Weekly Across Different Social Media Platforms
Overview
Below you will be able to see examples of posts which were most successful and least successful for every week across 'Facebook', 'Twitter' and 'LinkedIn'.
Week 1
Most Successful Posts
Most Successful 'Facebook' Post in Week 1
Most Successful 'Twitter' Post in Week 1
Most Successful 'LinkedIn' Post in Week 1
Least Successful Posts
Least Successful 'Twitter' Post in Week 1
Least Successful 'Facebook' Post in Week 1
Least Successful 'LinkedIn' Post in Week 1
Week 2
Most Successful Posts
Most Successful 'Twitter' Post in Week 2
Most Successful 'Facebook' Post in Week 2
Most Successful 'LinkedIn' Post in Week 2
Least Successful Posts
Least Successful 'Twitter' Post in Week 2
Least Successful 'Facebook' Post in Week 2
Least Successful 'LinkedIn' Post in Week 2
Week 3
Most Successful Posts
Most Successful 'Twitter' Post in Week 3
Most Successful 'Facebook' Post in Week 3
Most Successful 'LinkedIn' Post in Week 3
Least Successful Posts
Least Successful 'Twitter' Post in Week 3
Least Successful 'Facebook' Post in Week 3
Least Successful 'LinkedIn' Post in Week 3
Week 4
Most Successful Posts
Most Successful 'Twitter' Post in Week 4
Most Successful 'Facebook' Post in Week 4

Most Successful 'LinkedIn' Post in Week 4
Least Successful Posts
Least Successful 'Twitter' Post in Week 4
Least Successful 'Facebook' Post in Week 4
Least Successful 'LinkedIn' Post in Week 4
Week 5
Most Successful Posts
Most Successful 'Twitter' Post in Week 5
Most Successful 'Facebook' Post in Week 5
Most Successful 'LinkedIn' Post in Week 5
Least Successful Posts
Least Successful 'Twitter' Post in Week 5
Least Successful 'Facebook' Post in Week 5
Least Successful 'LinkedIn' Post in Week 5
Scheduling Utilising 'Buffer'
Overview
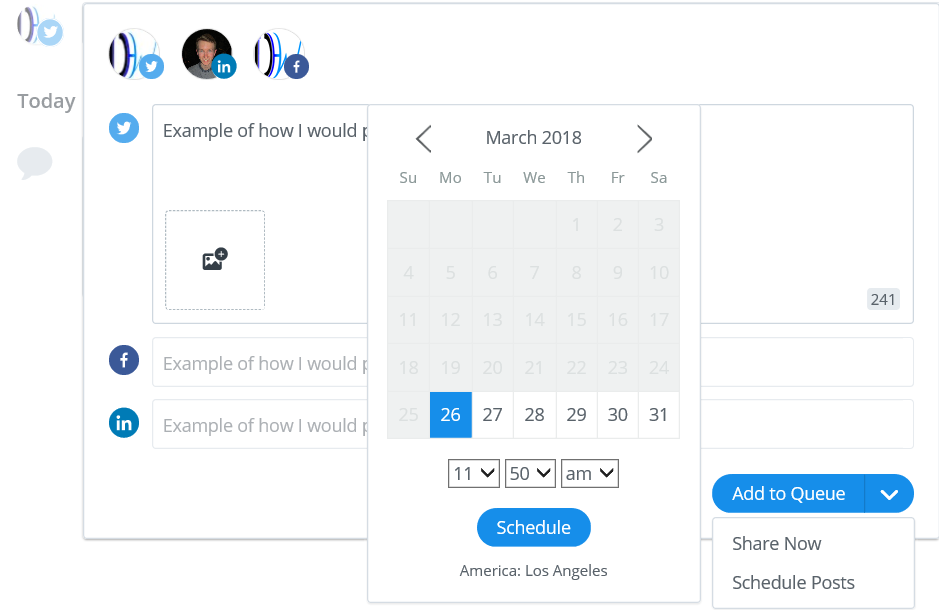
At the beginning of the campaign, I didn’t use the scheduling software tool ‘Buffer’ even though mentioned in the action plan but I did intend to use it. Then after a few days of the campaign, I then used ‘Buffer’ to help and sometimes I would have scheduled the posts in the evening for the following day or in the morning of the day the posts would have been released. Examples of how I achieved this can be seen below.
Firstly, I would have selected which social media platforms I wanted to release the posts to. The profiles first of all had to be configured with 'Buffer' for this to happen. In order to choose which social media profiles to release the posts to, I had to select the icons at the top. Then I would have written the content for each post of which I could have customised for each platform if I wished. After I had written the content, I would have then scheduled what time the posts would have been released by selecting the arrow next to the ‘Add to Queue’ section and then selecting a time. Normally this would have related to an American time zone of which I researched was approximately seven or eight hours behind the time in the United Kingdom which meant that I had to calculate the times for each platform. Once this had been completed, I then selected ‘Schedule Posts’.
Examples of Using 'Buffer'
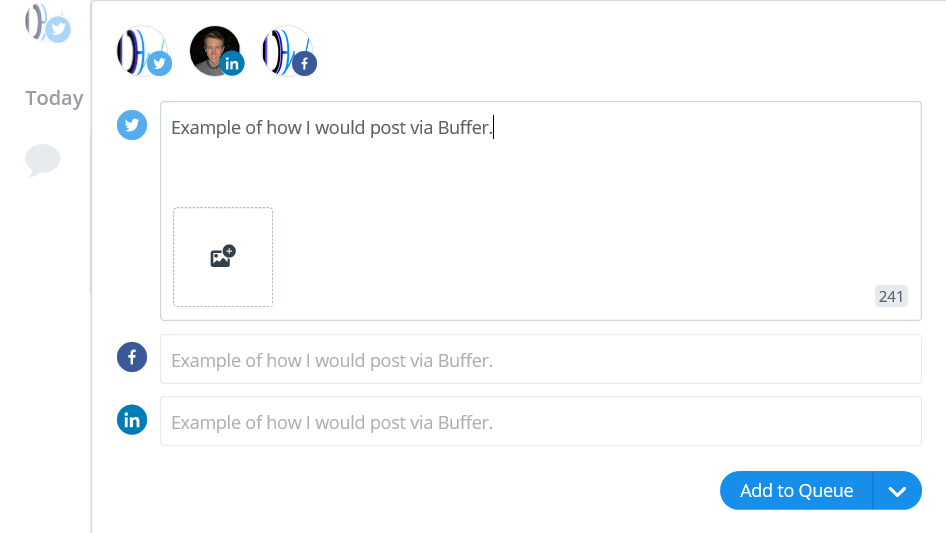
Selecting the Platforms to Release to and Writing Content
Scheduling the Times for the Posts to be Released
Statistics Summary for the Campaign
Before and After Statistics
Overview
Below are the main statistics for the start of the campaign (before the campaign had gone 'live') and the end of the campaign and how this changed during the few weeks. For a full report of statistics with explanations, please view the weekly statistics report situated at the bottom of this page. These statistics were for 'Facebook', 'Twitter', 'LinkedIn', webmail/e-mails and 'Google Analytics'.
Before the Campaign had Gone 'Live'
'Facebook'
Page Followers for the 'Facebook' Page

Page Likes for the 'Facebook' Page
'Twitter'
Overview of the 'Twitter' Page (Main Focus on Followers)
'LinkedIn'
Total Connections on 'LinkedIn'
Webmail/E-mails
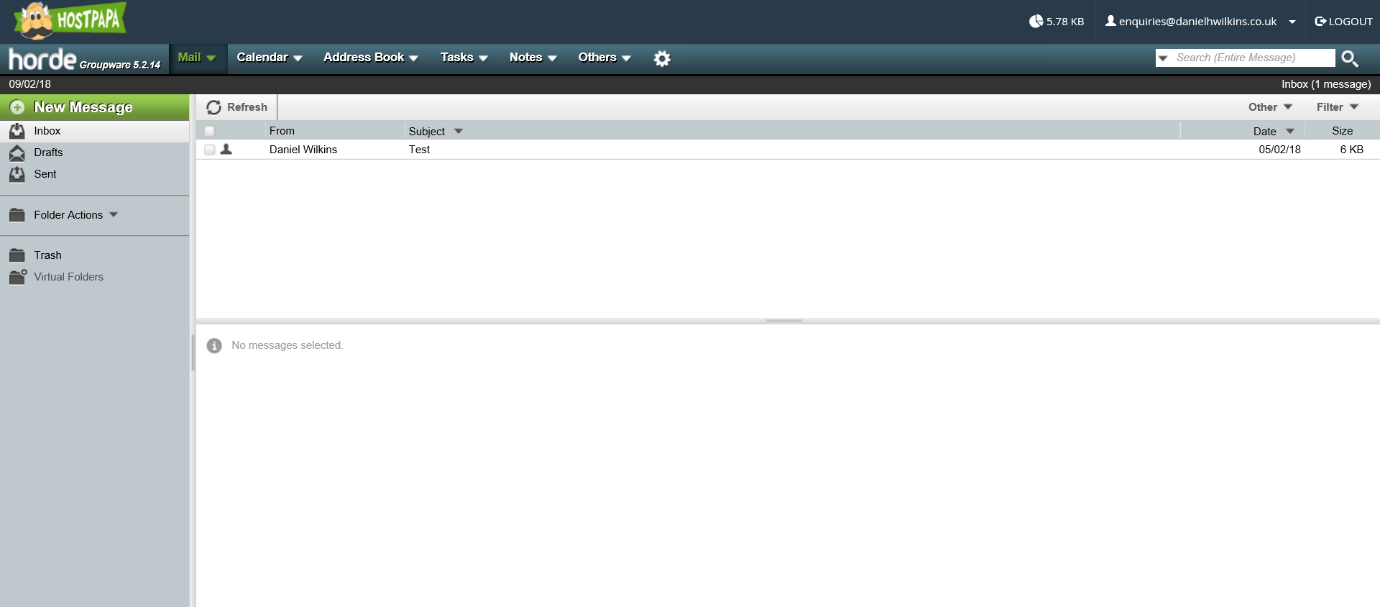
E-mails in the Inbox of the Webmail Service
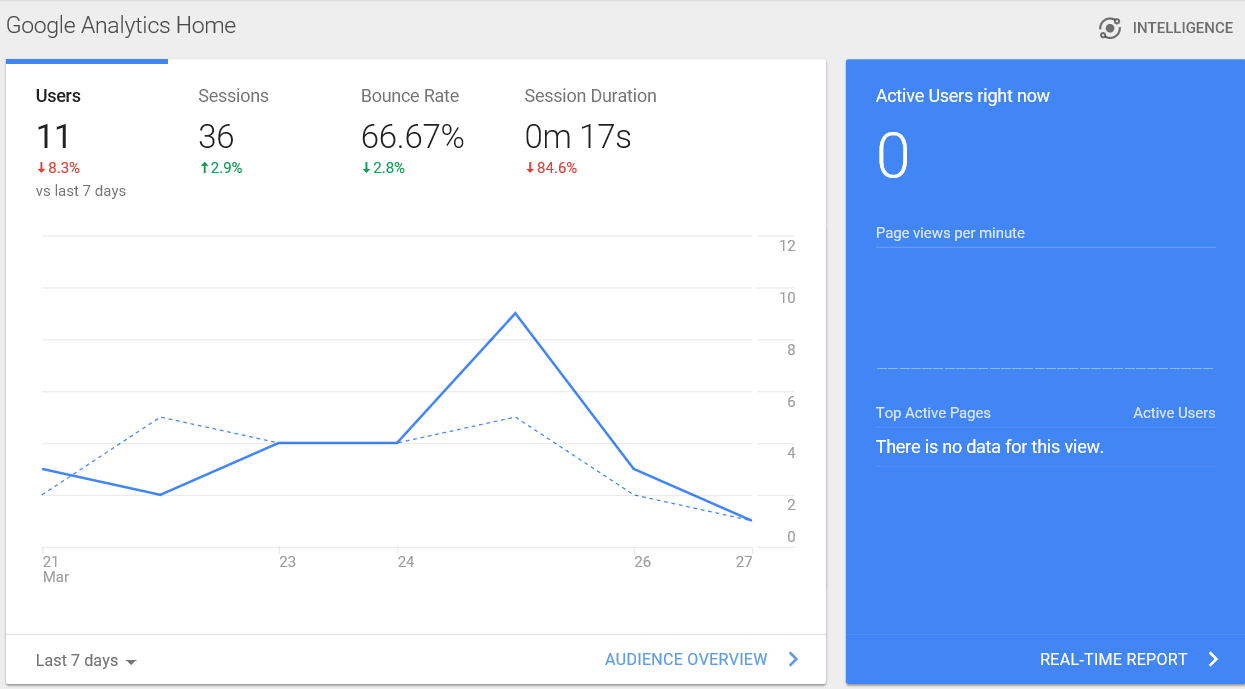
'Google Analytics'
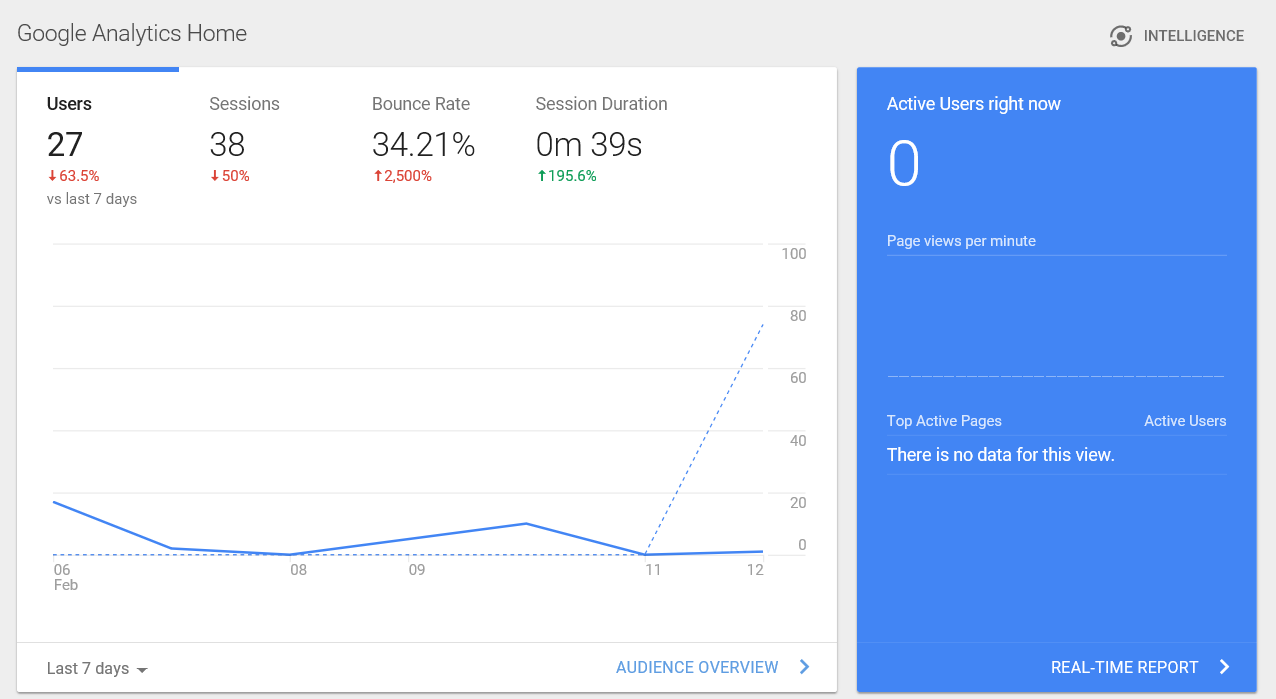
A Summary of the Main Statistics for 'Google Analytics'
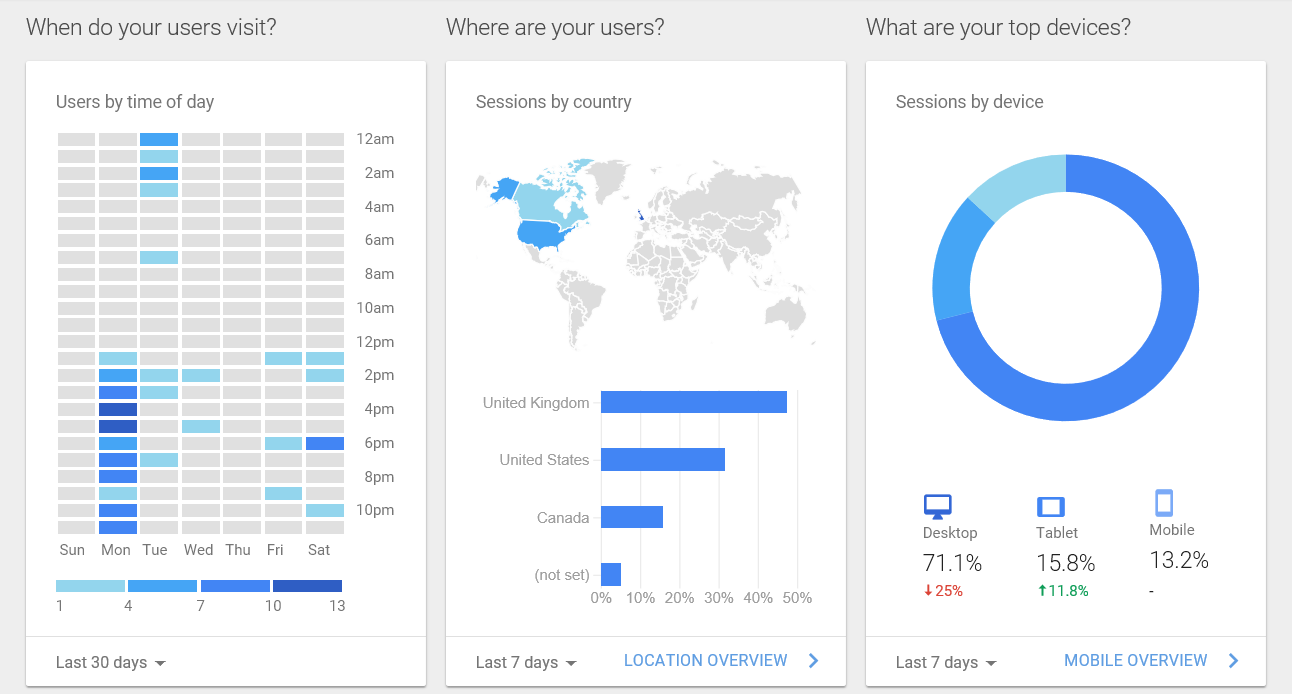
Times, Places and Devices Website Statistics from 'Google Analytics'
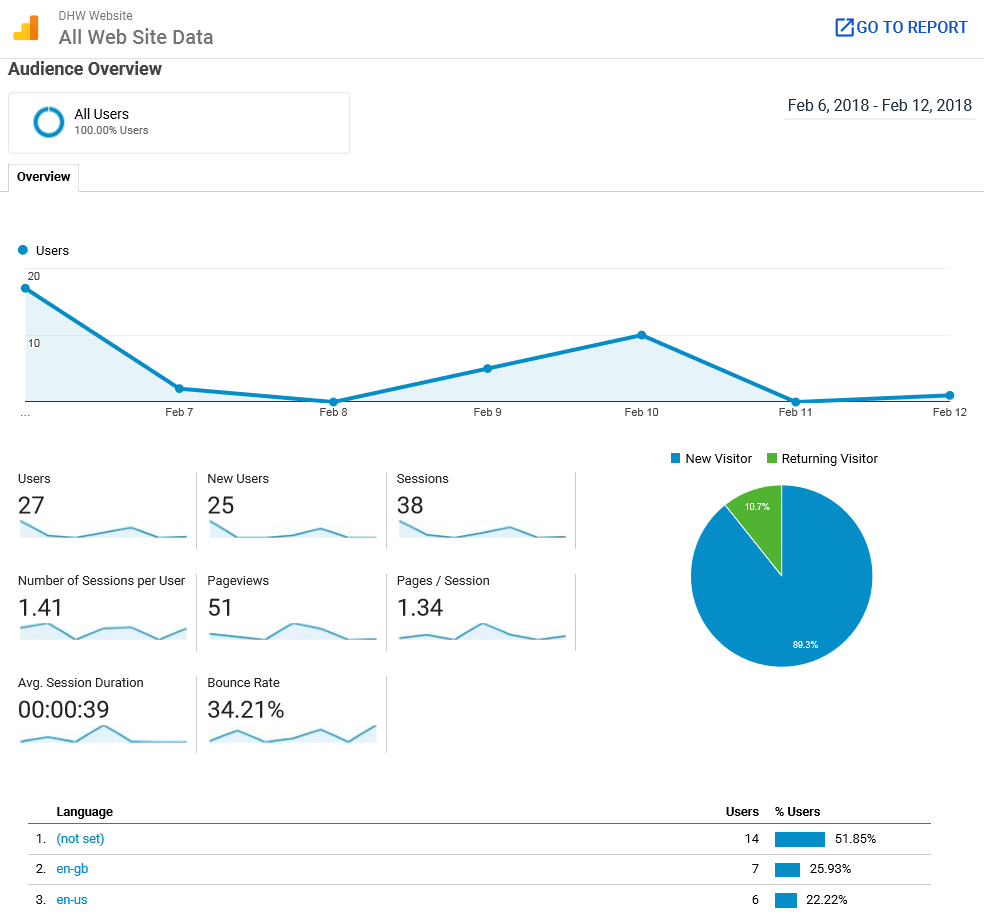
Audience Website Statistics from 'Google Analytics'
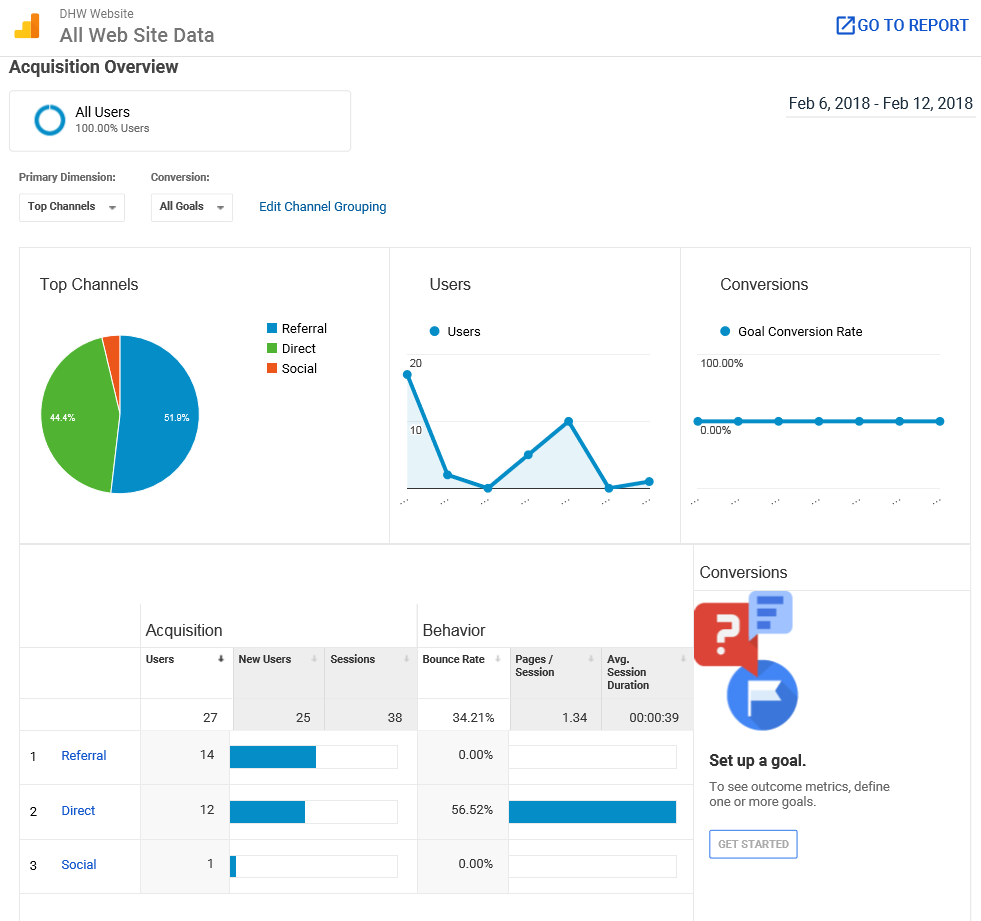
Acquisition Website Statistics from 'Google Analytics'
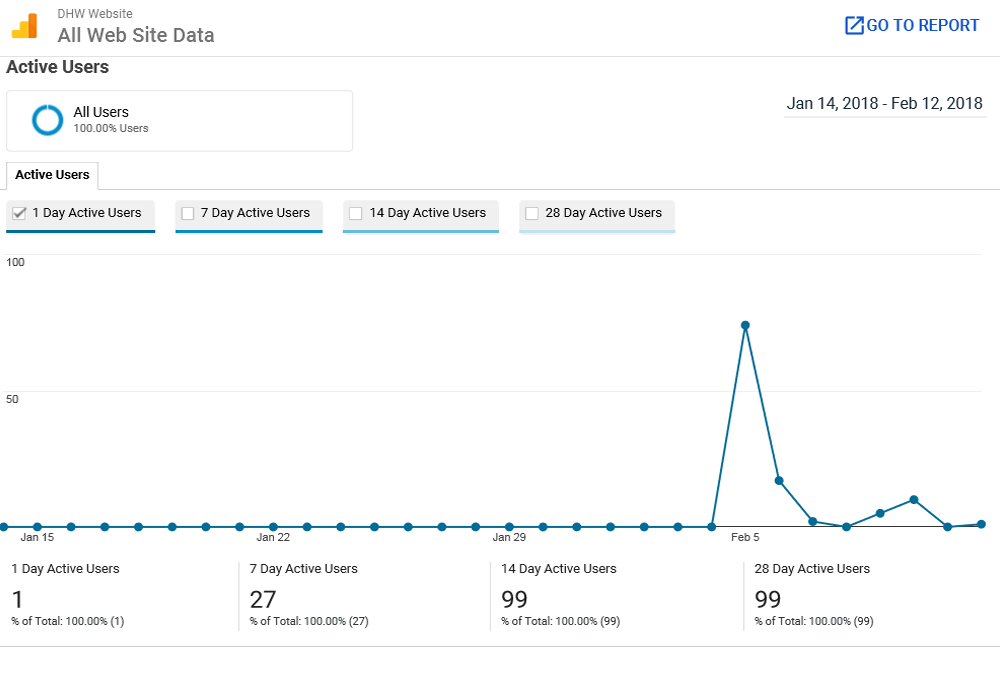
Active Users Website Statistics from 'Google Analytics'
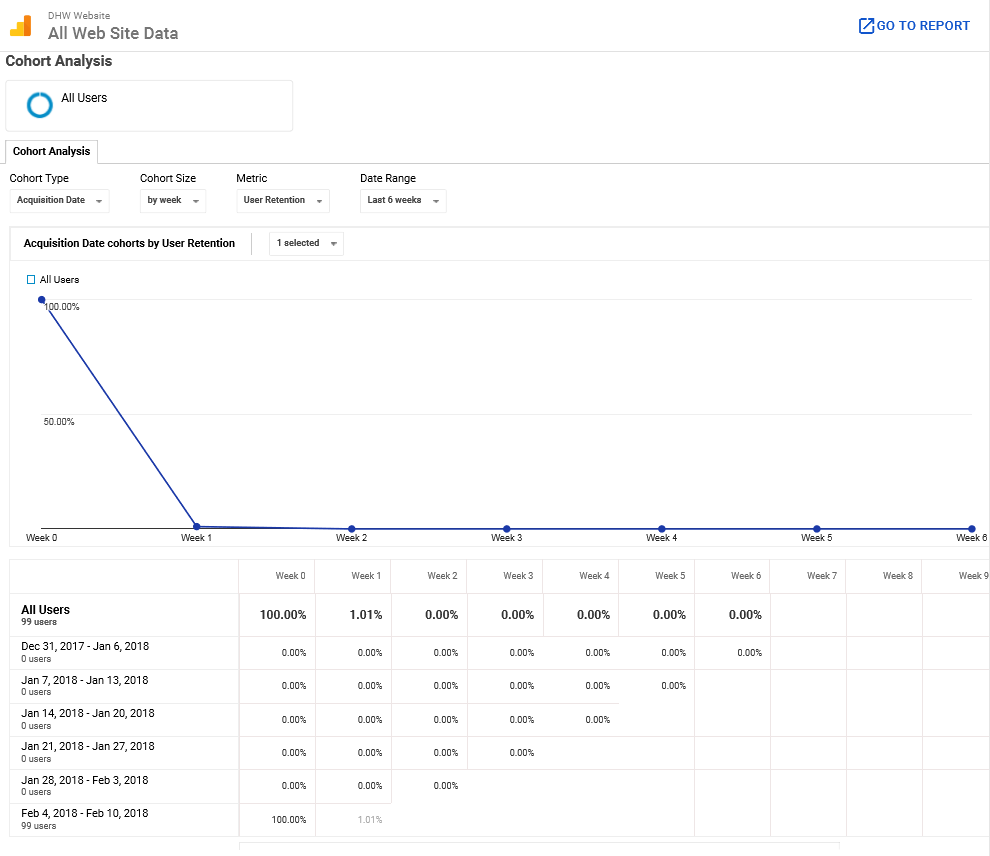
Cohort Analysis Website Statistics from 'Google Analytics'
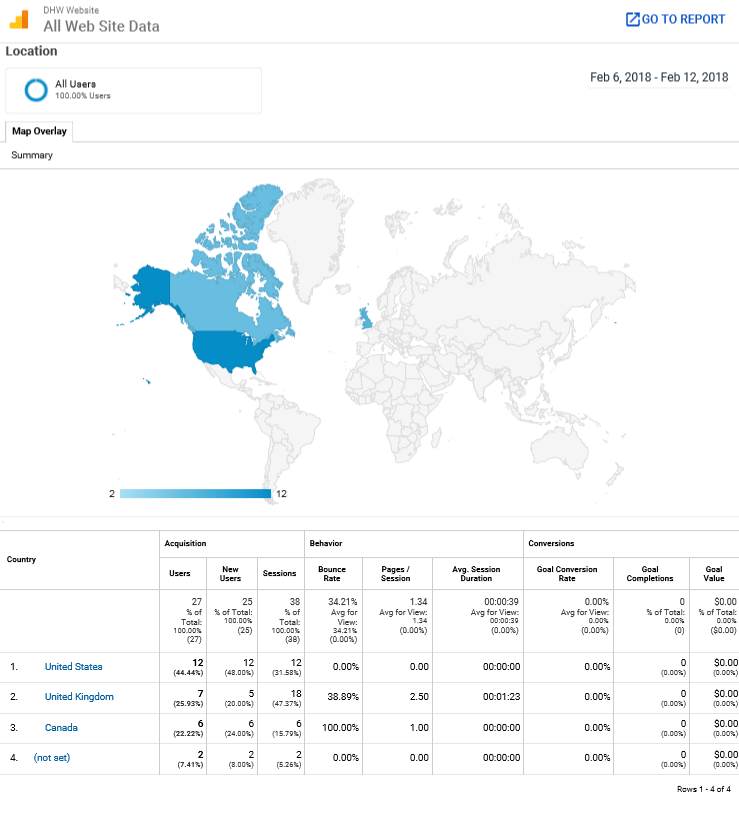
User Location Website Statistics from 'Google Analytics'
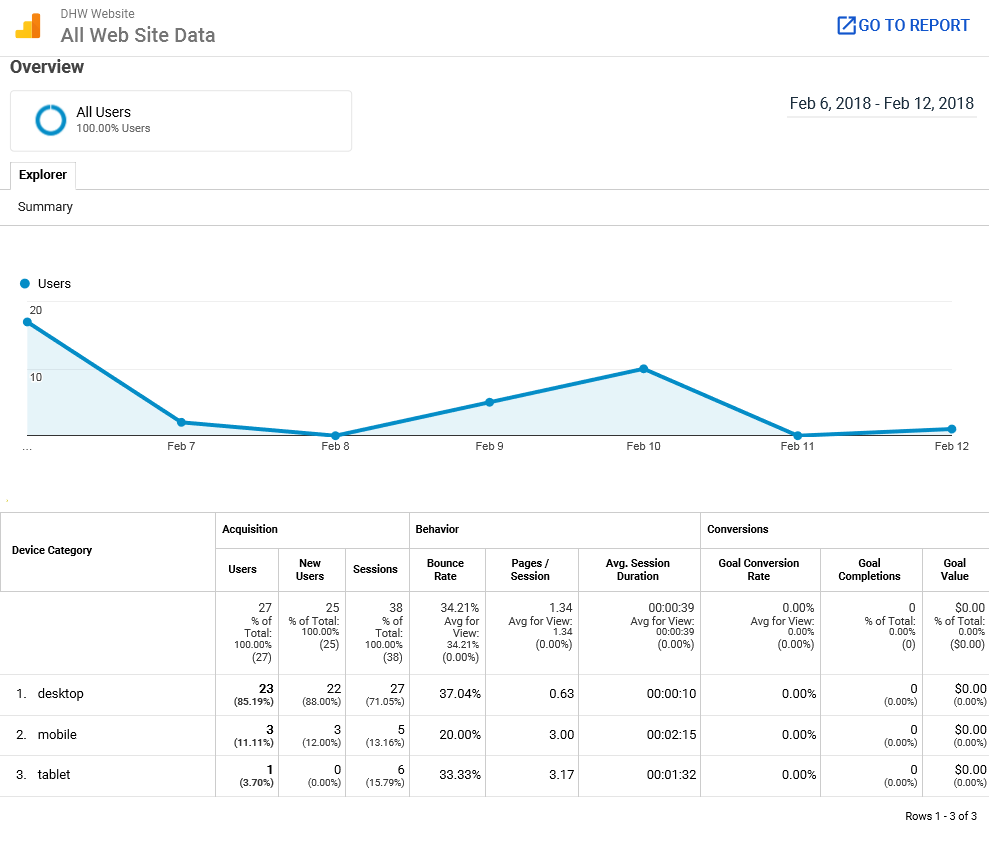
Device Use Website Statistics from 'Google Analytics'
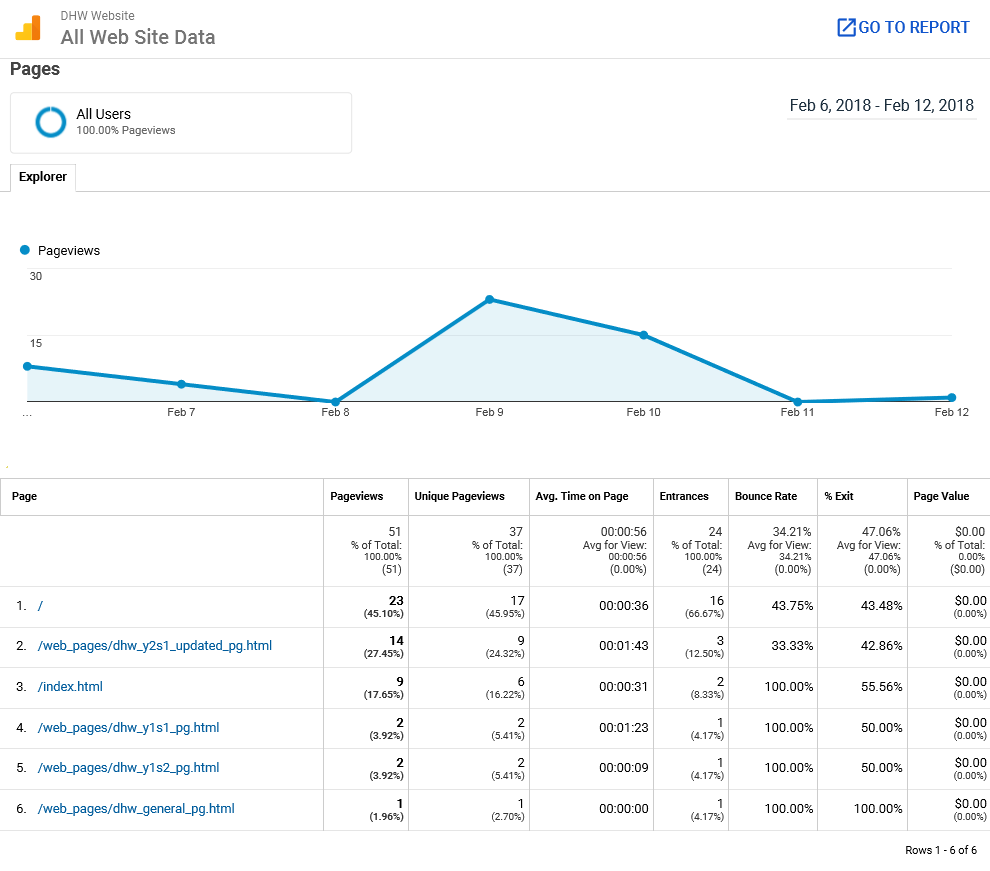
Website Pages Statistics from 'Google Analytics'
After the Campaign (The Final Week)
'Facebook'
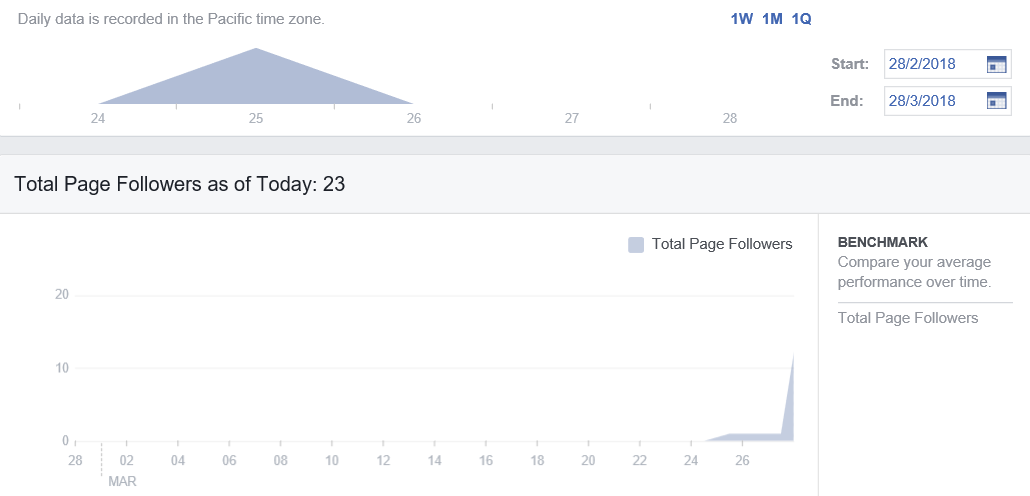
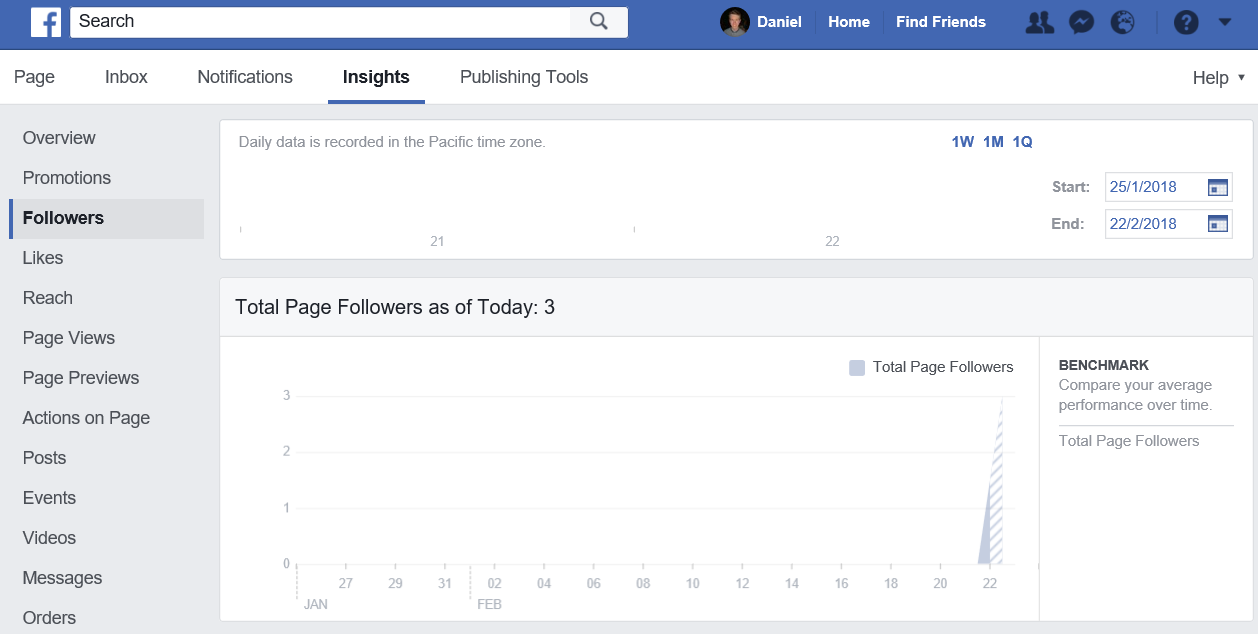
Page Followers for the 'Facebook' Page
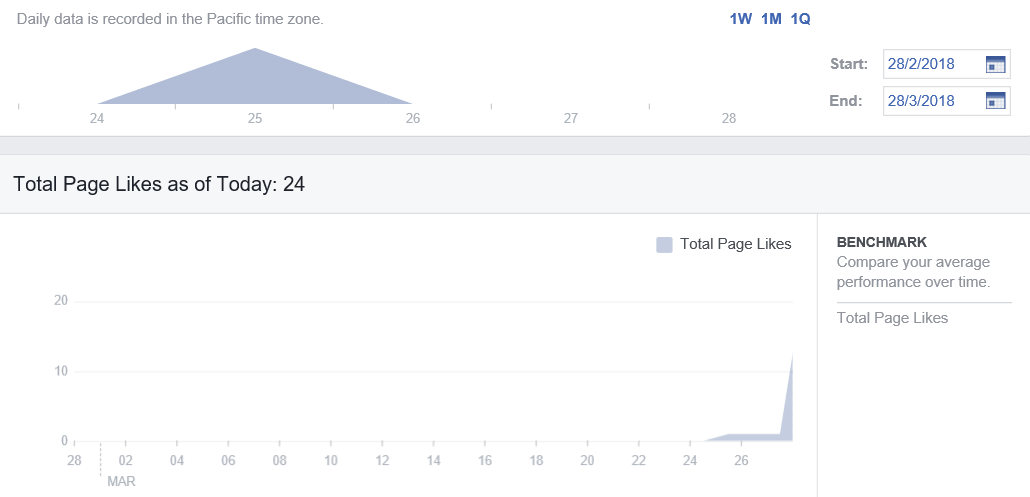
Page Likes for the 'Facebook' Page
'Twitter'
Overview of the 'Twitter' Page (Main Focus on Followers)
'LinkedIn'
Total Connections on 'LinkedIn'
Webmail/E-mails
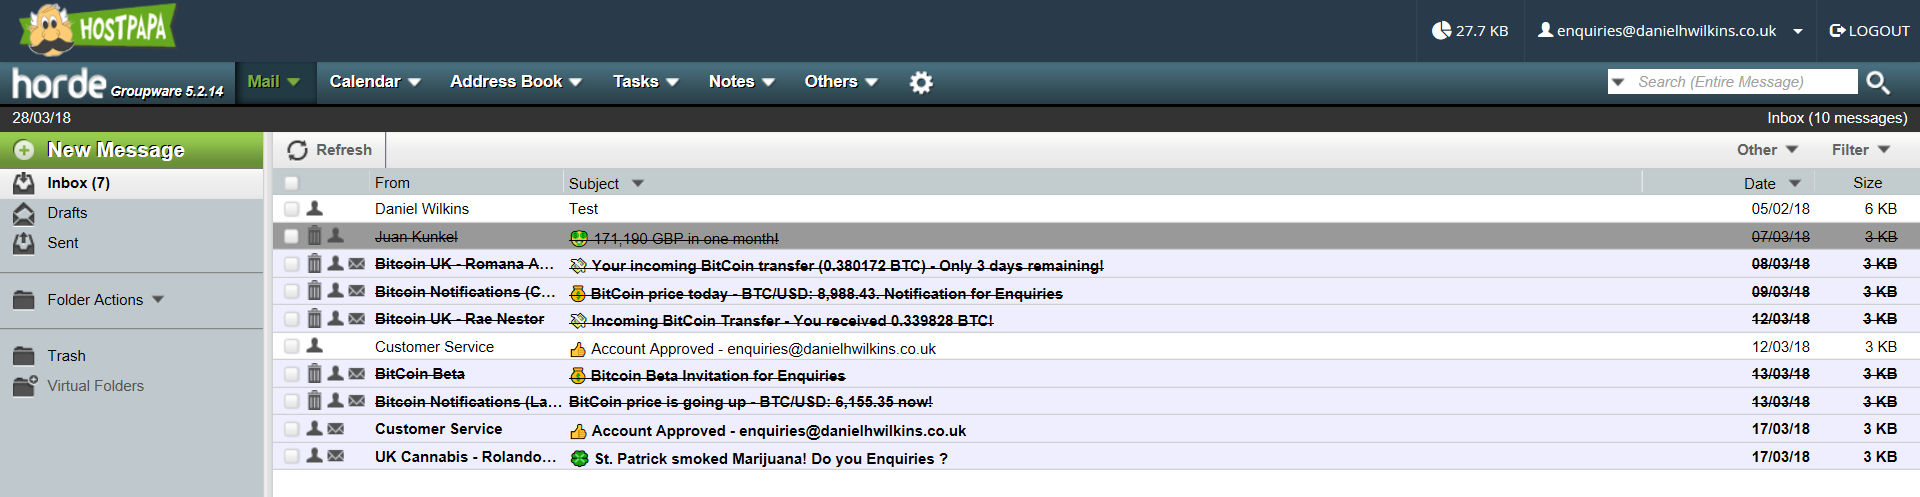
E-mails in the Inbox of the Webmail Service
'Google Analytics'
A Summary of the Main Statistics for 'Google Analytics'
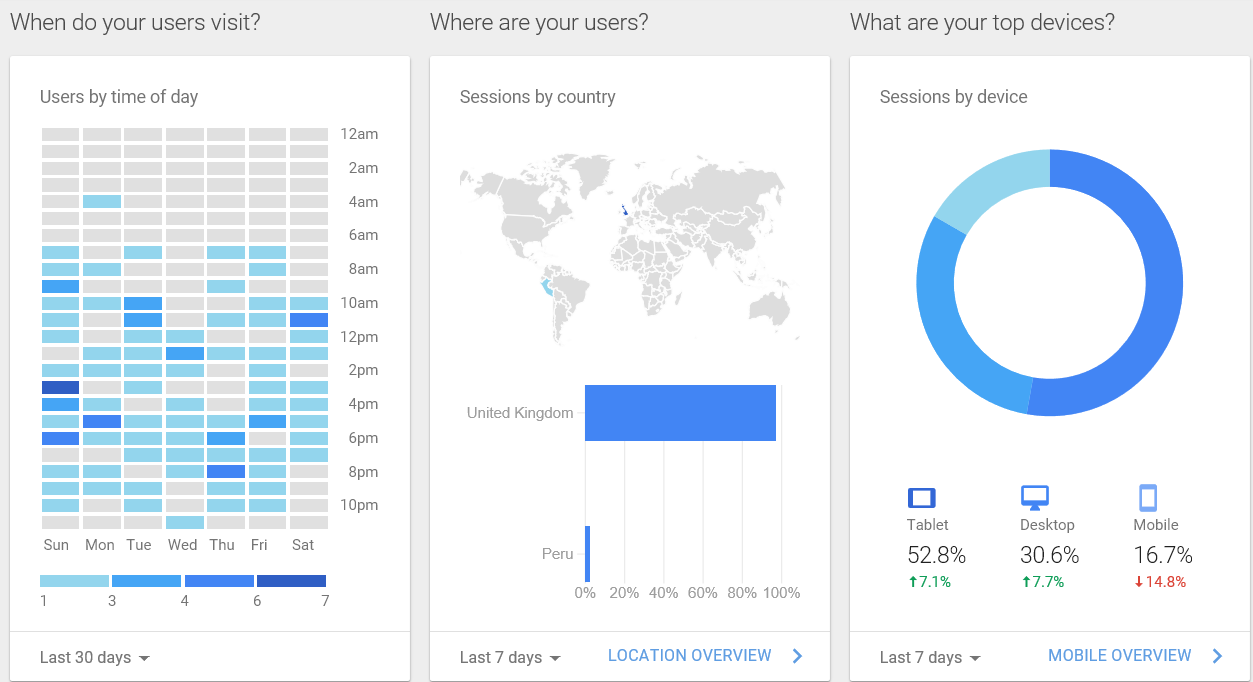
Times, Places and Devices Website Statistics from 'Google Analytics'
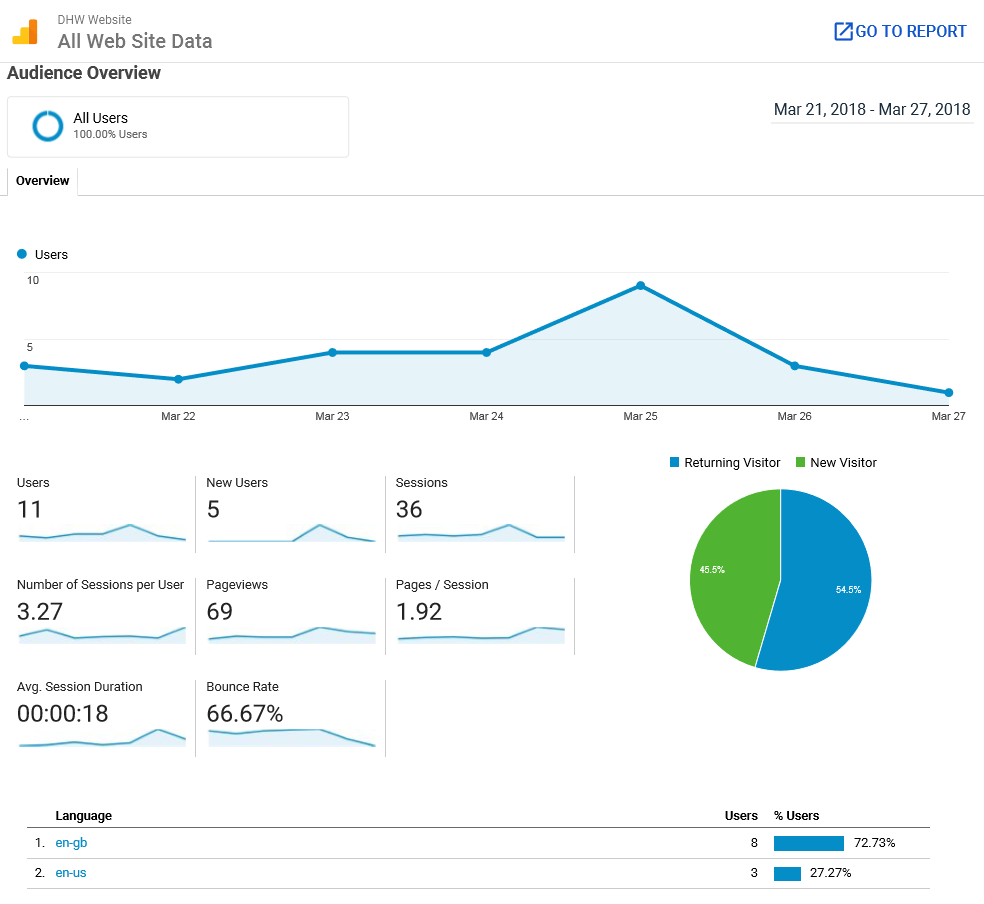
Audience Website Statistics from 'Google Analytics'
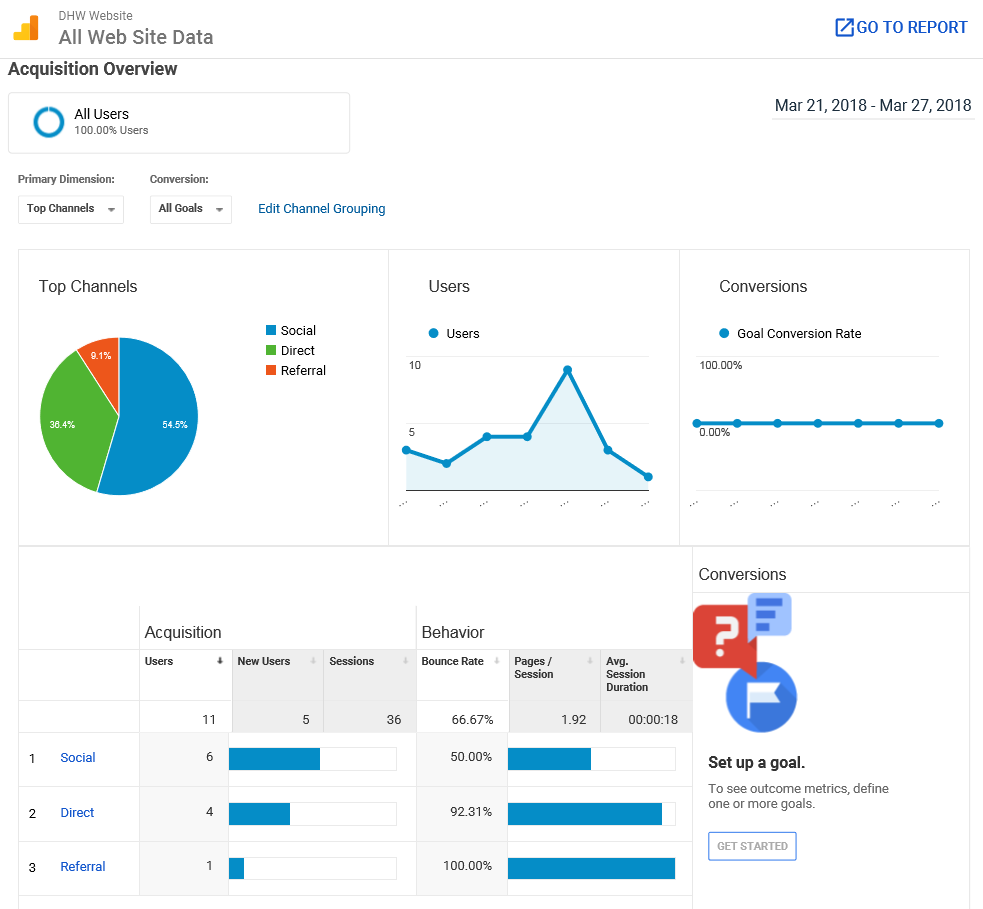
Acquisition Website Statistics from 'Google Analytics'
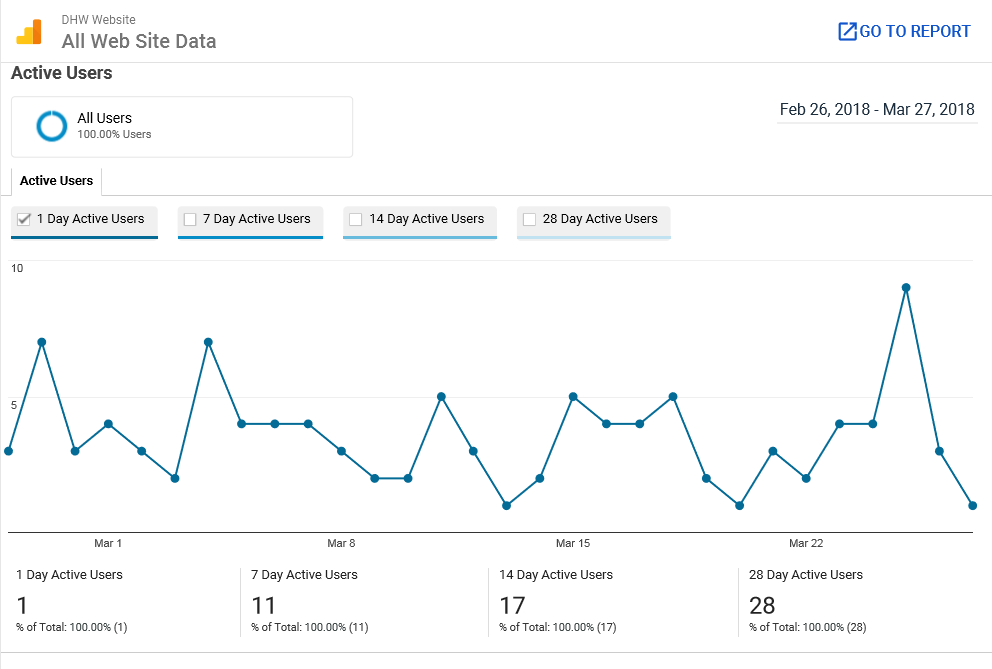
Active Users Website Statistics from 'Google Analytics'
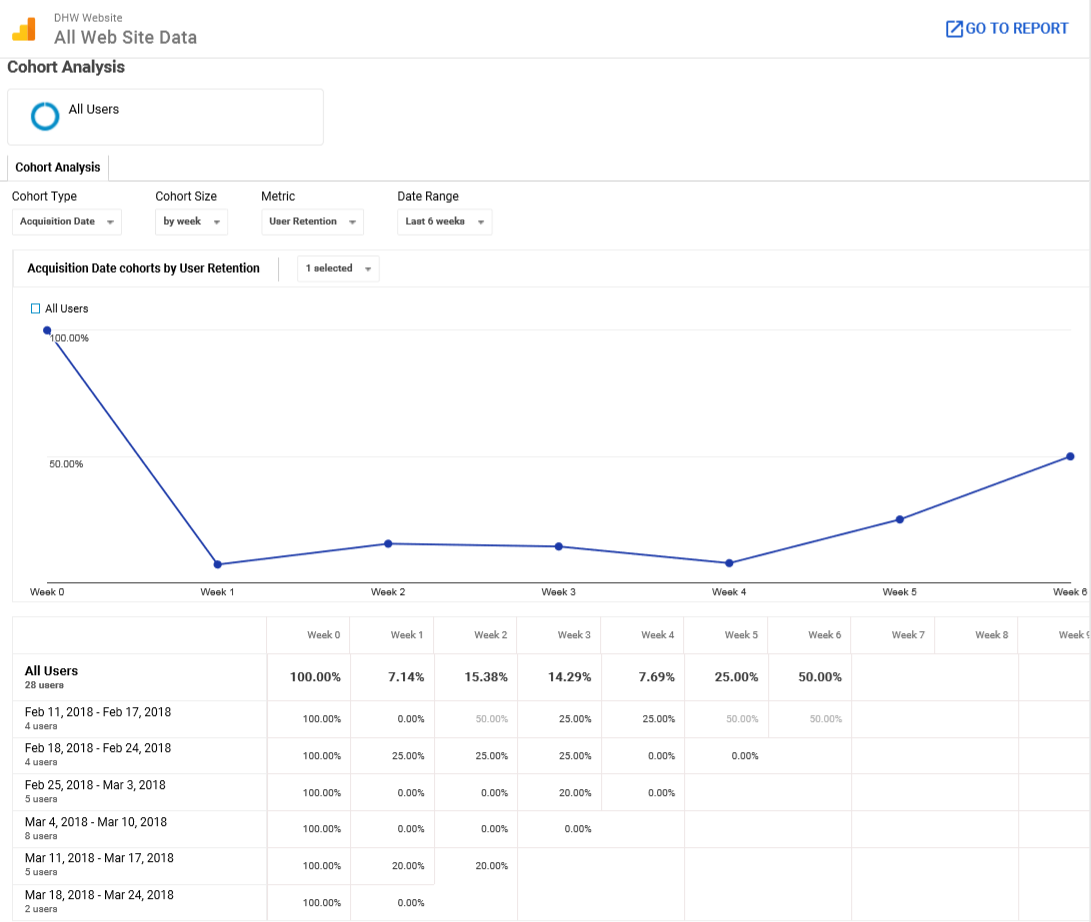
Cohort Analysis Website Statistics from 'Google Analytics'
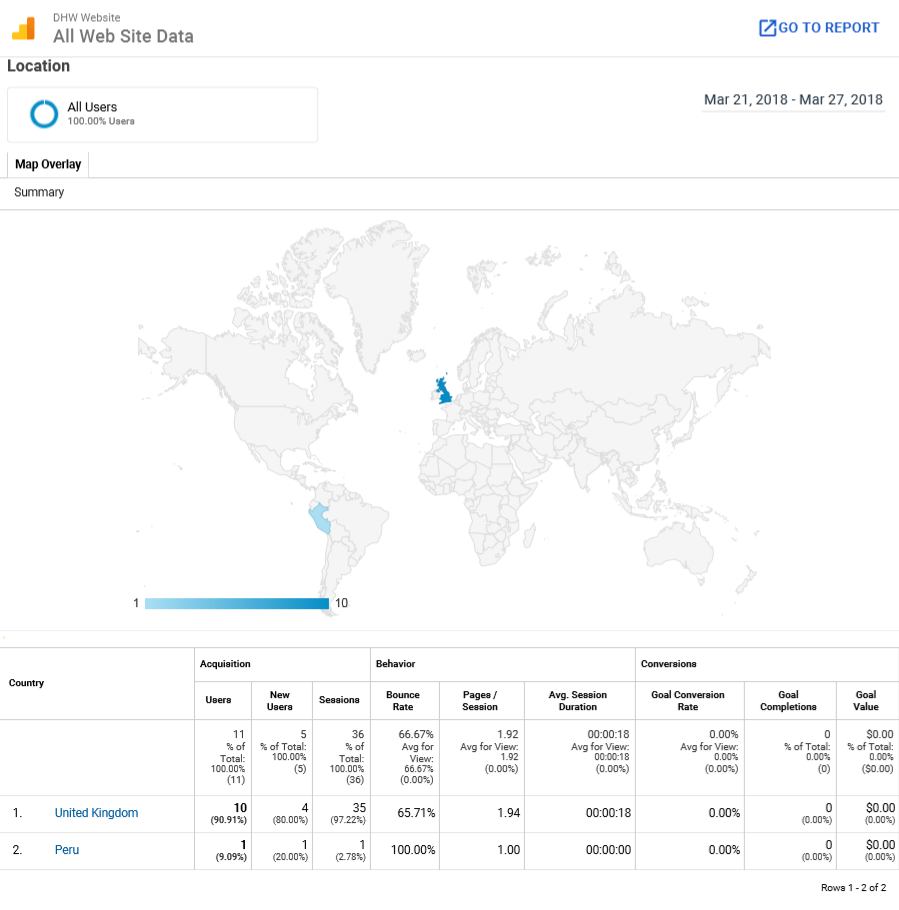
User Location Website Statistics from 'Google Analytics'
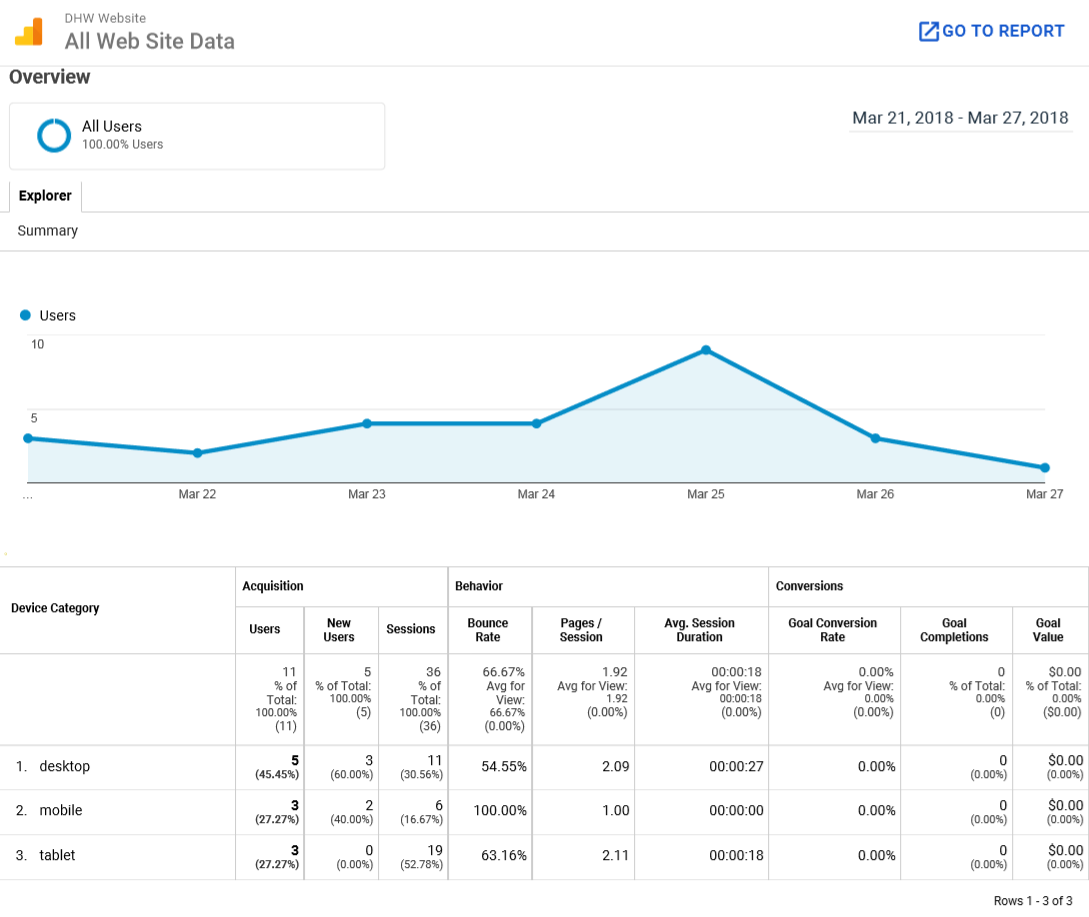
Device Use Website Statistics from 'Google Analytics'
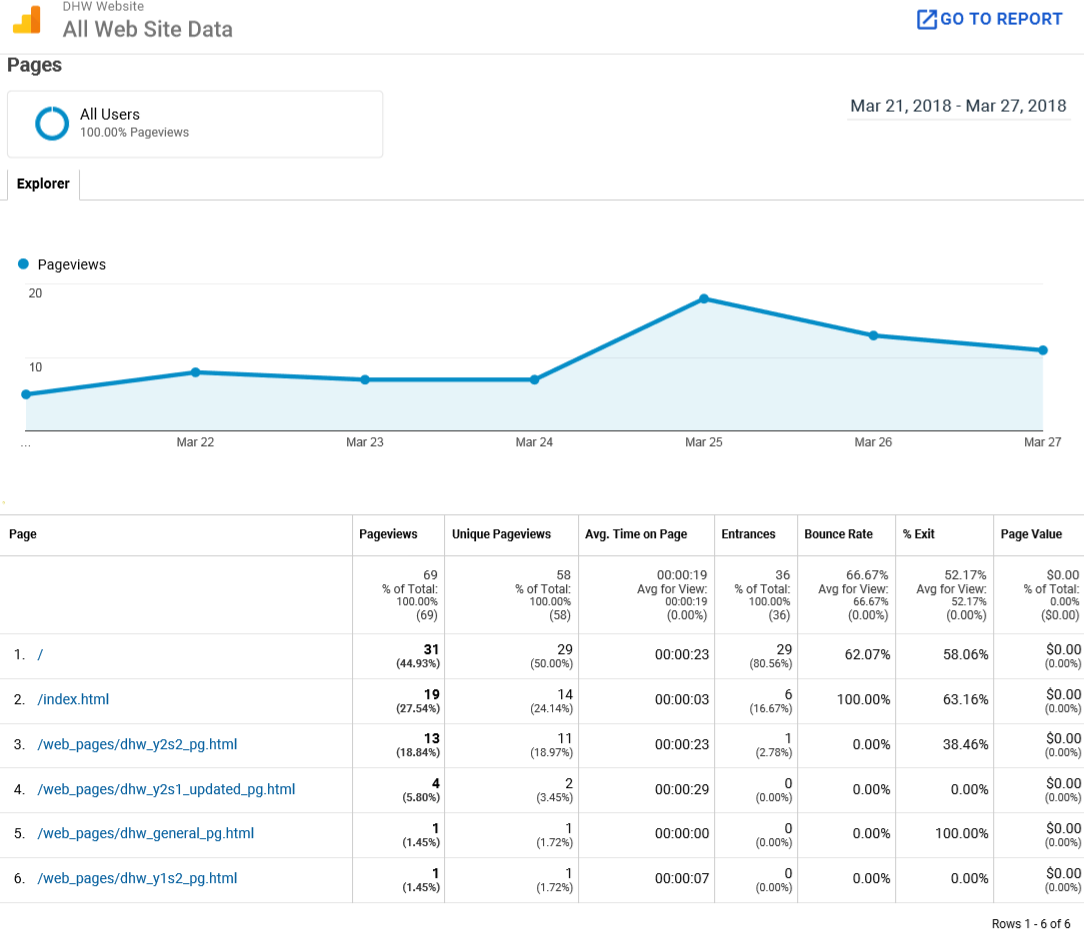
Website Pages Statistics from 'Google Analytics'
User Engagement Statistics
Overview
Below you will be able to see examples of user engagement figures for each social media platform utilised. For a full set of statistics with explanation, view the weekly statistics report at the end of this page. The first images for each platform show an early stage of the campaign and the second images display statistics towards the final stages of the campaign.
'Facebook'
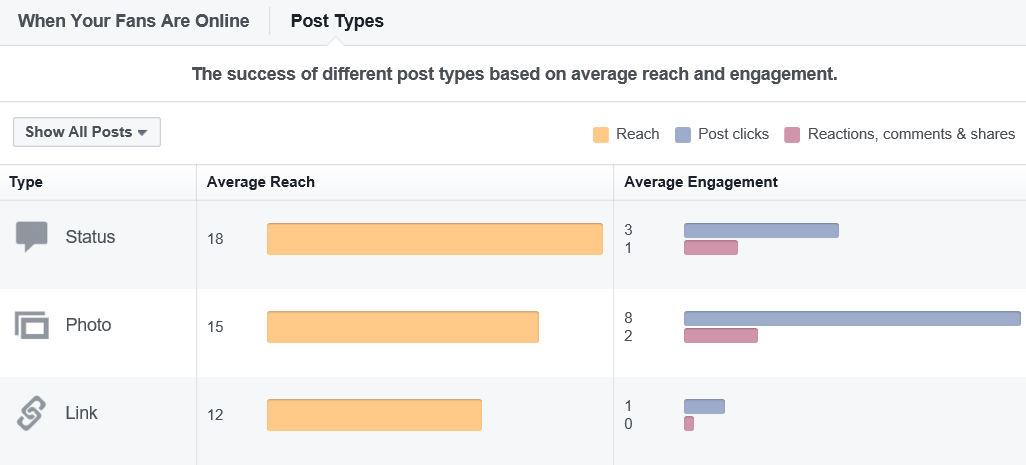
Engagement by Post Type - Early Stages
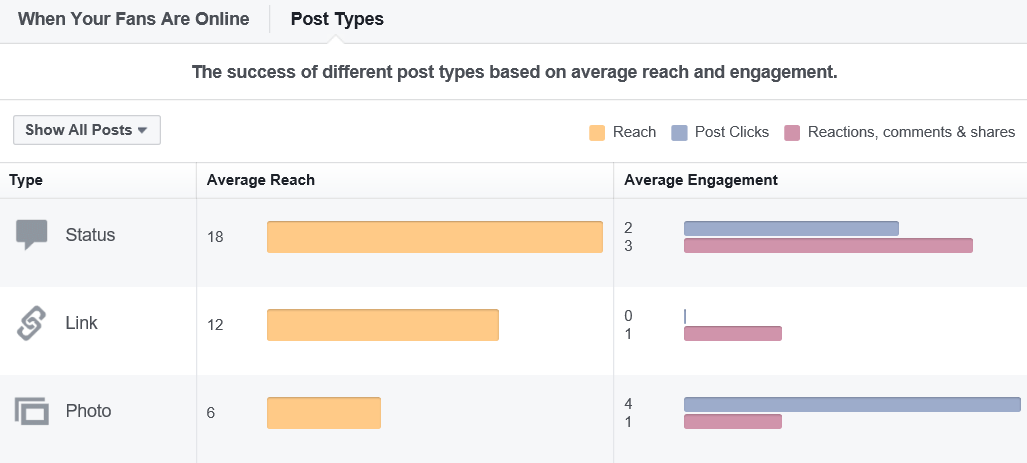
Engagement by Post Type - Later/Final Stages
'Twitter'
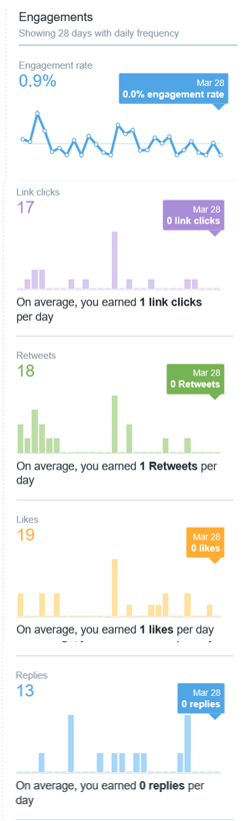
Engagement Overview - Early Stages
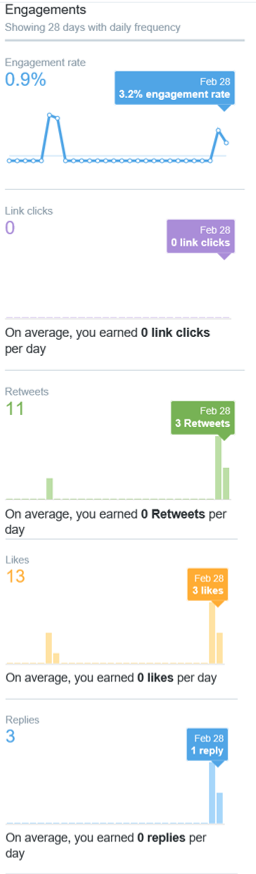
Engagement Overview - Later/Final Stages
'LinkedIn'
Engagement Overview - Early Stages
Engagement Overview - Later/Final Stages
'LinkedIn' Posts (Before and After)
Overview
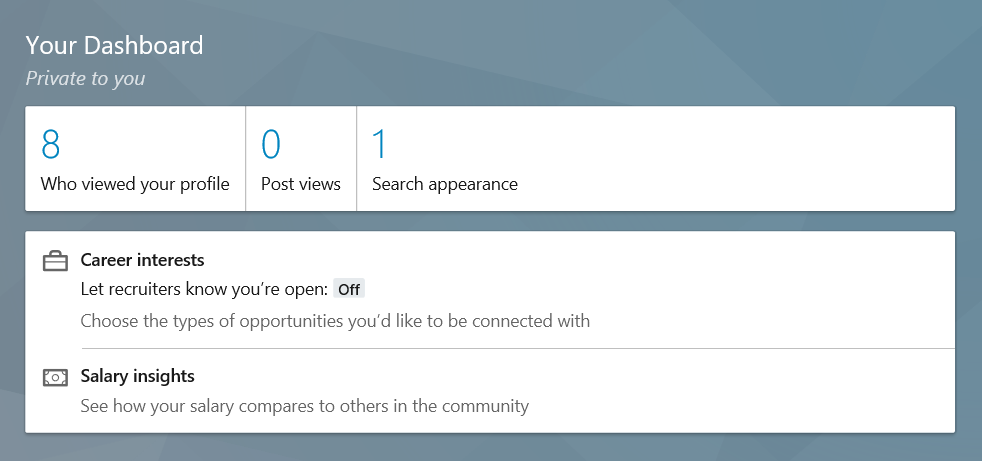
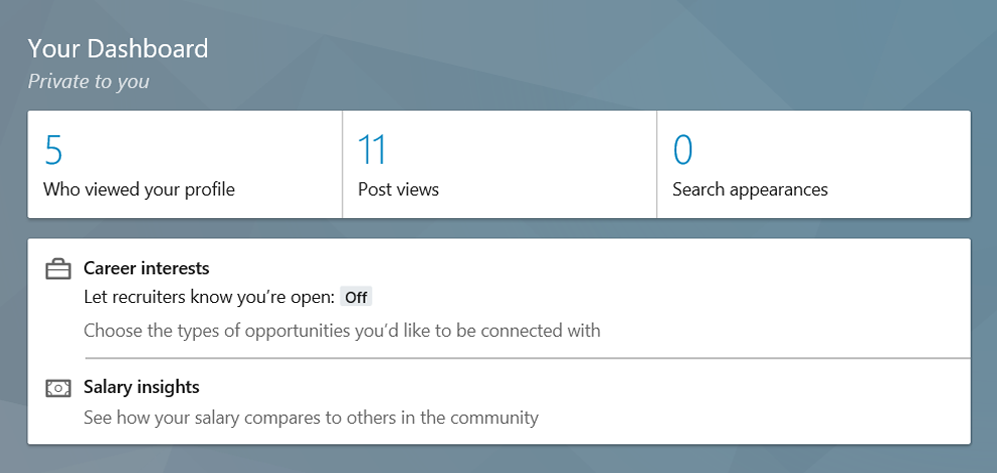
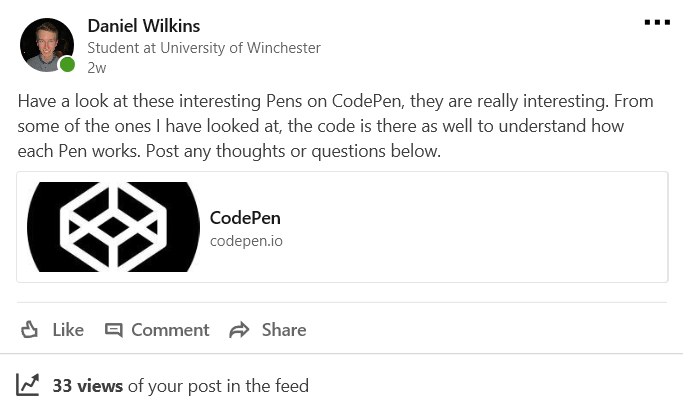
With regards to 'LinkedIn', because likes, comments and shares haven't been displayed for this platform as of yet, below you can view some examples both during the early stages of the campaign (first two images) and towards the latter stages as well (last two images).
As will be seen below, I didn't receive much interaction on the posts. To view all posts released for each social media platform, simply click on the social media links provided at the bottom of this page.
Early Stages of the Campaign
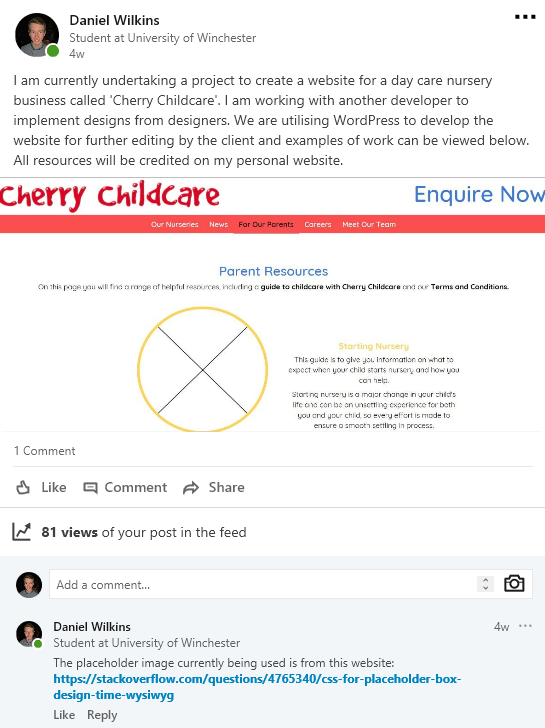
Example 1 of a Post During the Early Stages of the Campaign
Example 2 of a Post During the Early Stages of the Campaign
Latter Stages of the Campaign
Example 1 of a Post During the Latter Stages of the Campaign
Example 2 of a Post During the Latter Stages of the Campaign
The Best Followers Obtained
Overview
Below you will be able to see the people I had attracted with the content I released with regards to the best that could have related to the industry of website development.
The Best Followers
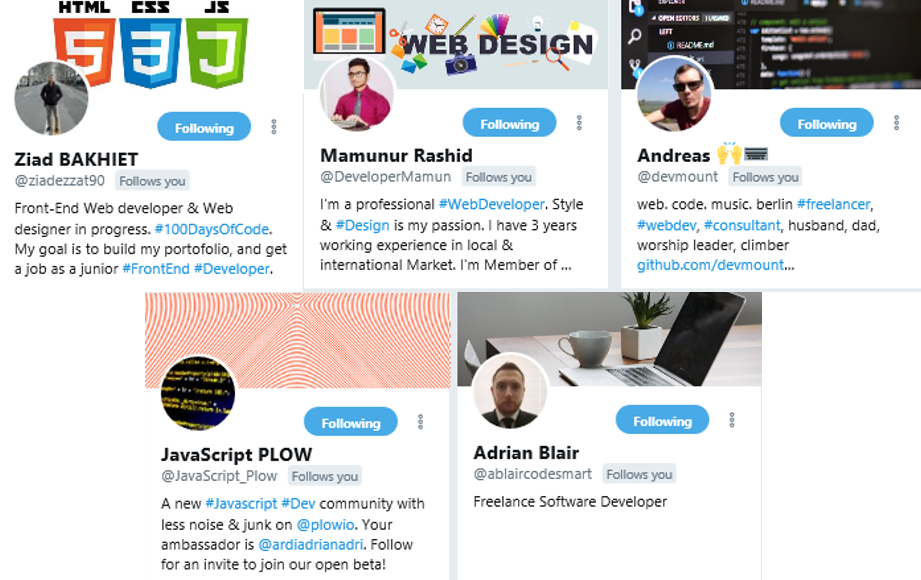
The Best Followers Obtained Relating to Website Development
Reflection
Did I achieve my Goals?
Overall, I did achieve the targets I had set myself for each social media platform, achieving a total of 16 connections for 'LinkedIn' when I wanted to gain at least six and achieving a total of 24 page likes and 23 page followers for 'Facebook' when I had set myself a target of obtaining at least 20 for each. However, with regards to 'Twitter' I did want to have at least 25 followers of which I did at one stage of the campaign but overall, I only managed to gain 21 followers. I wanted to also increase the amount of views on my website and as is evident I did attract different interest. However, I would have liked to have had higher statistics at certain stages. With regards to the 'SMART' objectives for different types of content, which can be viewed in the action plan situated at the bottom of this page, I didn't achieve what I had hoped to with engagement and actions remaining at low levels throughout the campaign. This was most likely because I was posting too much and not including enough visuals. Overall, the campaign performed better in some areas compared to others.
What Would I do Differently Next Time?
If I could undertake this campaign again, I would post less regularly and try and implement more images to attract more interest to the posts. I would also include more retweets of content from others and like the content of others as well across all social media platforms. This, in my opinion, would attract more interest towards my accounts and, as a result, increase the amount of interactions, followers and website views. I would also join discussions using the 'Groups' feature on 'LinkedIn' to attract more interest from industry professionals/specialists.
To view more detail about this project, please view the document provided below.
A More Detailed Process (Document)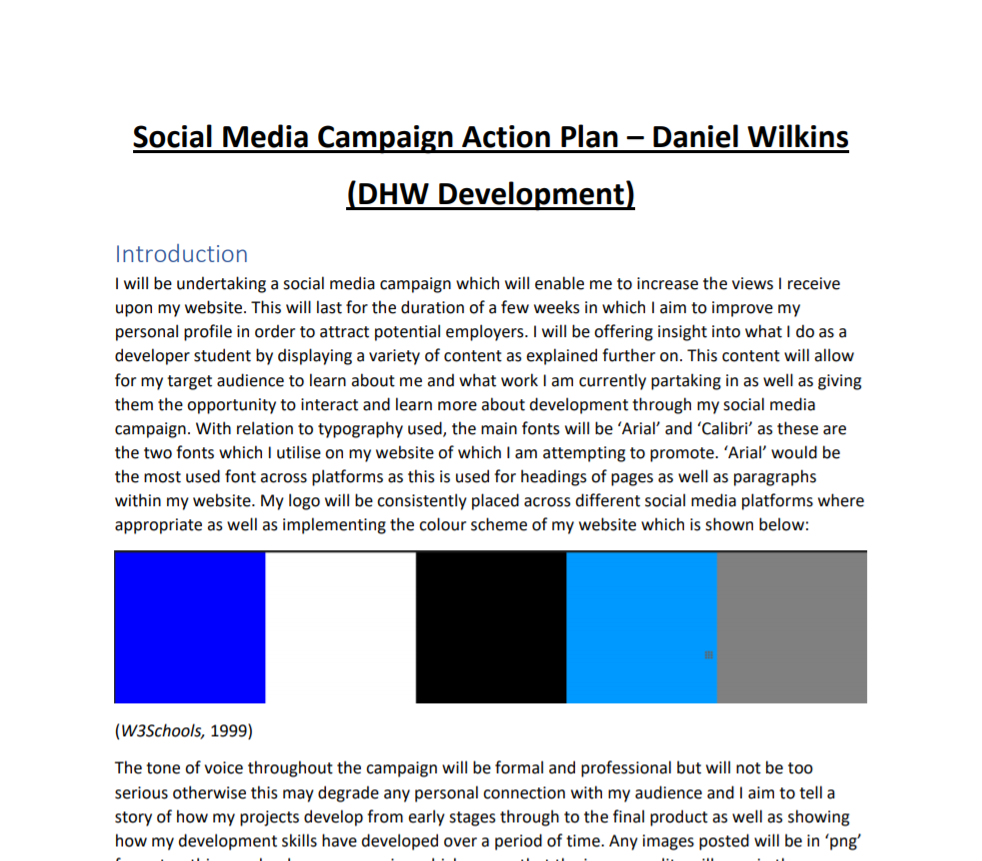
An Image of Part of the Action Plan (Please Select the Link Icon Above)
An Image of Part of the Weekly Statistics Report (Please Select the Link Icon Above)